11장에서는 Istio 의 컨트롤 플레인의 성능 튜닝에 대해 다룹니다
Performance-tuning the control plane
- 실습 git: https://github.com/istioinaction/book-source-code
- 출처 : Istio in Action 챕터11
다루는 내용
- 컨트롤 플레인의 성능 요소 이해
- 성능 모니터링 방법 알기
- 성능을 확인하는 주요 지표
- 성능 최적화 방법 이해 👈🏻
Goal!
실습환경
- minikube (k8s) 및 istio 설치. 참고: https://netpple.github.io/2023/Istio-Environment/
- 실습 네임스페이스 : istioinaction
- 실습 디렉토리 : book-source-code
실습초기화
반복 실습 등을 위해 초기화 후 사용하세요
## istioinaction 초기화
kubectl delete ns istioinaction &&
kubectl create ns istioinaction &&
kubectl label ns istioinaction istio-injection=enabled

## istio-system 초기화
kubectl delete sidecar,authorizationpolicy,peerauthentication,requestauthentication -n istio-system --all

## istiod 초기화
istioctl install --set profile=demo
11.1 컨트롤 플레인의 최우선 목표
“데이터 플레인을 Desired State 로 동기화 (Sync) 하는 것”
서비스 메시 환경의 설정과 제어
1) mesh operator API
- 컨트롤 플레인은 서비스 메시의 “뇌”에 해당하는데요
- 컨트롤 플레인은 서비스 메시 제어를 위한 API를 제공합니다
- 앞에서 Istio의 여러 커스텀 리소스를 살펴 보았는데요
- Gateway, VirtualService, DestinationRules …
- 이 API를 통해서 메시의 동작을 조작하고 서비스 프록시를 설정합니다
- 지금까지는 주로 이 API에 대한 얘기를 다뤄 왔는데요 이게 전부가 아닙니다
서비스디스커버리, 서비스 상태, 오토스케일링 이벤트 등등 각종 런타임 환경에 대한 세부적인 많은 것들이 컨트롤프레인으로 추상화 되어 있습니다
Istio 컨트롤 플레인은 “kubernetes events”를 watch 하여 런타임 변경상황에 대해서 지속적으로 반응하고 메시 설정에 반영합니다
2) kubernetes events
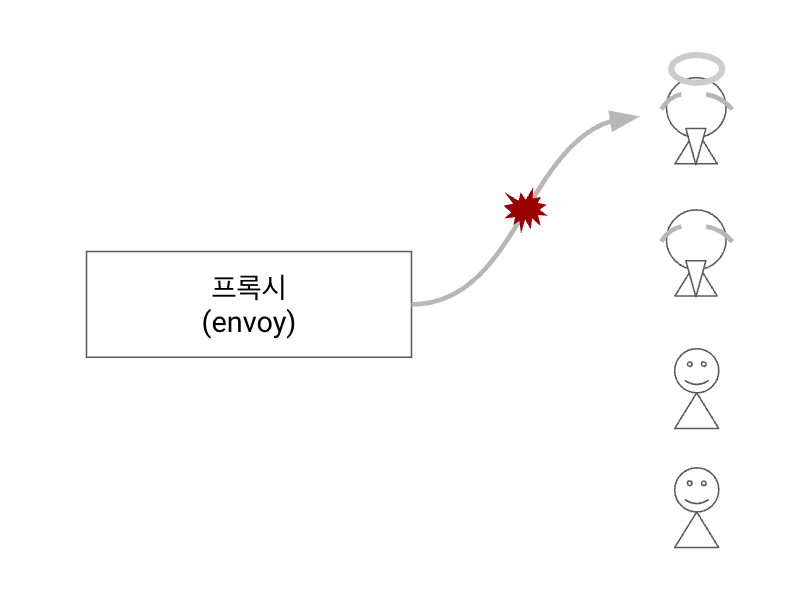
new desired state를 “지속적으로 반영”하는 프로세스 필요- state 를 반영하는 프로세스는 언제든 “타이밍 이슈”가 발생할 수 있음
- 컨트롤 플레인에 “일시적 장애”가 발생하면 워크로드에 변화된 상태를 반영하지 못할 수 있음
- 예) Phantom Workloads (유령 워크로드) ⇒ 이미 제거된 엔드포인트로 트래픽 라우팅
- unhealthy workload 에 대해 이벤트 발생
- 업데이트 지연 ⇒
stale configuration초래
*stale(outdated, 오래된) configuration: 새로운 설정값이 아직 반영이 안된 오래된 설정 stale configuration⇒ 존재하지 않는 (phantom) 워크로드로 트래픽 라우팅 초래
이미 죽은 워크로드” 인데 살아 있는 줄 알고 트래픽을 보내는 상황을 빗대어 “phantom(유령) 워크로드” 로 표현
Istio 에서 unhealty workload 로 트래픽 라우팅을 결정하는 시점과
쿠버네티스에서 unhealthy workload 를 정리하는 이벤트 사이에 미묘한 타이밍 이슈가 발생할 수 있음
“Eventually consistent nature” ~ 이처럼 데이터 플레인에서 “일시적인 불일치를 허용하는 특징”을 이해해야 합니다
즉, stale configuration 은 언제든 발생할 수 있습니다. 6장 Resilience 에서 이를 보완하는 방법을 살펴보았습니다
- (방법1)
retry하여 다른 healthy 엔드포인트로 라우트 하는 방법 - (방법2)
outlier detection을 통해 요청이 실패한 엔드포인트를 클러스터에서 제거하는 방법
이처럼 서비스 메시에서 “동기화 (Sync)”는 중요한데요. 컨트롤 플레인에서 어떻게 새로운 설정과 상태를 지속적으로 데이터 플레인에 동기화 하는지 이어서 살펴보겠습니다
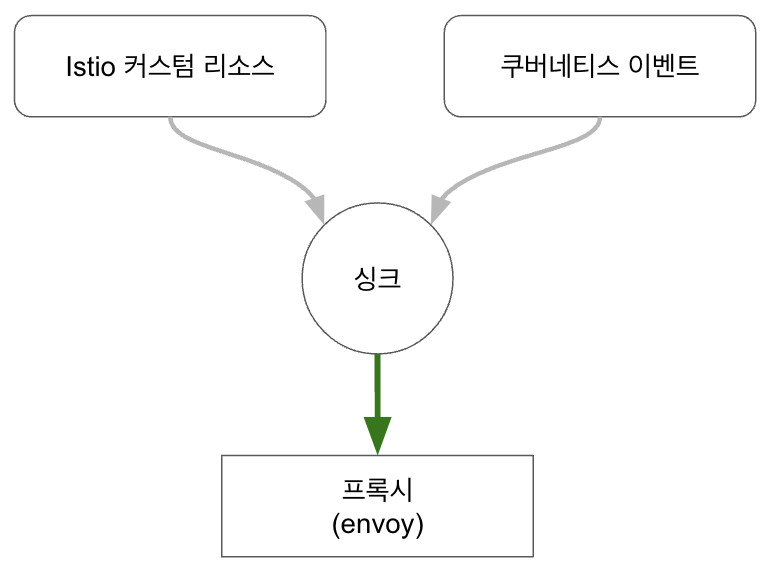
11.1.1 데이터 플레인의 동기화 과정 이해하기
데이터 플레인 동기화 과정
- 컨트롤 플레인에서 쿠버네티스 “이벤트” 수신 “desired state”
- “이벤트”를 “Envoy 컨피그”로 변환
- “Envoy 컨피그”를 데이터 플레인의 서비스 프록시(Envoy)로 푸시
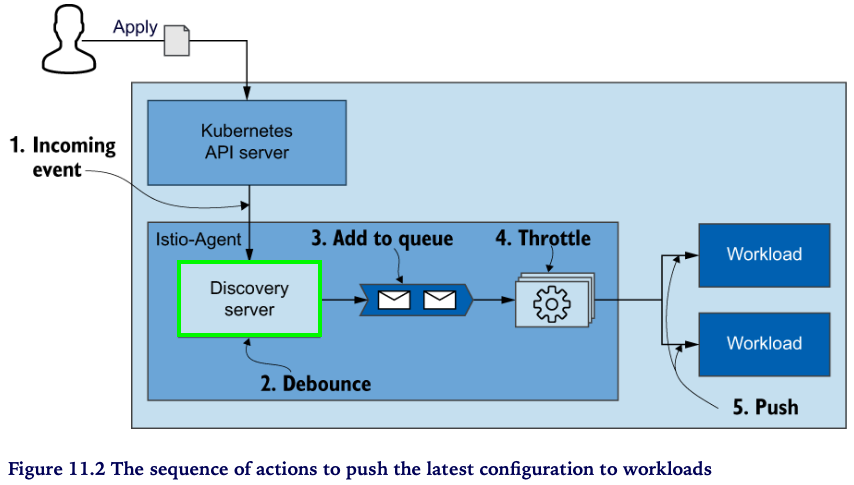
아래 그림에서 좀 더 상세하게 절차를 살펴봅시다
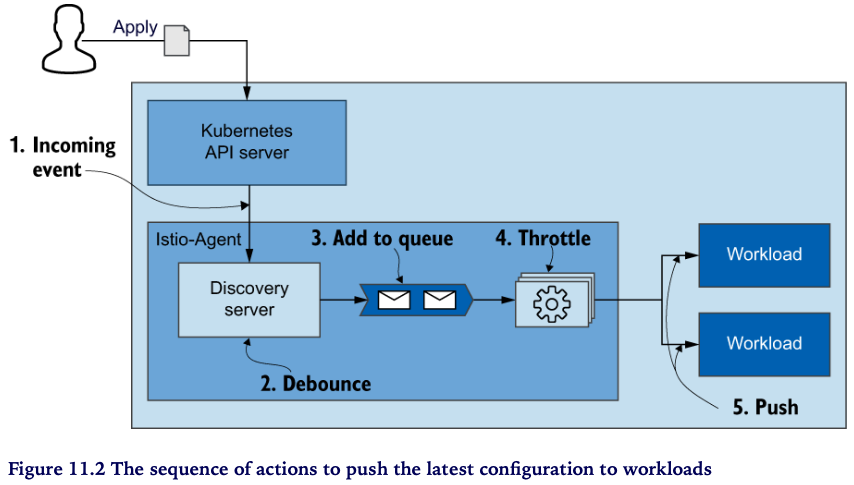
- Incoming event - “이벤트 수신”으로 부터 동기화 프로세스가 시작(트리거) 됩니다
- Debounce - 이벤트는 istiod 내부의 Discovery server 에서 수신합니다. 이 때, 수신된 이벤트는 바로 큐로 보내지 않습니다 (바로큐 X)
- batch and merge for delay time : 정의된 delay time 동안 후속 이벤트들을 모아서 일괄처리하고 merge 하면서 기다립니다 ⇒ 이러한 작업을 debouncing 라고 합니다. debounce 는 time-consuming 태스크가 자주 발생하지 않도록 조절하는 방법입니다
- 좀 더 부연하자면 이벤트가 와리가리 할 수 있기 때문에 일정시간 이벤트를 모아서 중복이벤트들은 제거하고 한번에 처리할 수 있는 이벤트들은 merge 하는 등의 작업이 debounce 입니다
- 예를 들어, 사용자가 토글 버튼을 클릭하는 이벤트를 처리한다고 합시다. 이 때, 일정시간 동안 사용자의 클릭 (이벤트)에 대한 처리를 대기하게 하면 대기시간 동안에 사용자가 토글버튼을 여러번 클릭 하더라도 해당 이벤트들을 모아서 최종적인 이벤트 판정은 한번만 내림으로써 시스템 처리 부담을 줄일 수 있습니다. 이러한 기법이 debounce 입니다
- Add to queue
- Throttle - queue 에서 Convert 단계로의 이벤트 유입을 조절하여 최적의 성능을 낼 수 있도록 합니다
- Convert - 그림에서 단계가 생략돼 있지만, 이벤트를 envoy 설정으로 변환하는 주요한 과정입니다 앞서 쓰로틀링을 하는 이유도 Convert 단계의 처리부하를 조절하기 위한 목적이죠
- Push - Convert가 완료된 envoy 설정을 데이터 플레인의 각 워크로드로 push 합니다
11.1.2 성능을 결정하는 요소
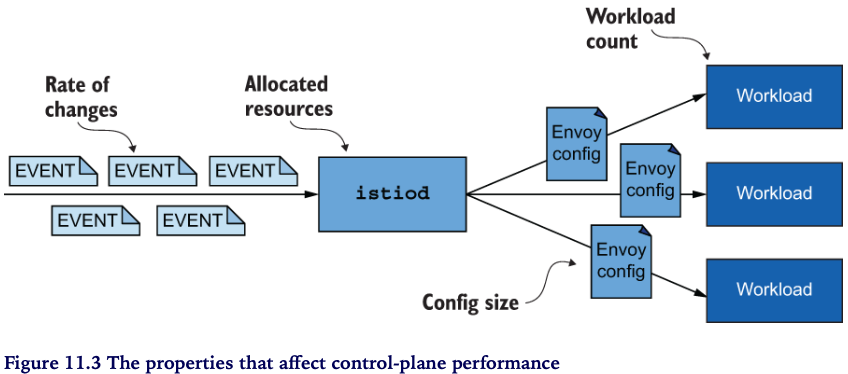
성능을 결정하는 요소
- Rate of changes - 이벤트가 많은가요 ? (자주, 많이 뭔가 바뀌나요)
- Allocated resources - (처리량 대비) istiod 리소스는 충분한가요 ?
- Config size - Envoy 컨피그 크기(size) 가 큰가요?
- Workload count - 업데이트할 워크로드가 많나요 ?
앞으로 성능 최적화를 위해 이러한 요소들을 어떻게 다루는지 살펴볼텐데요.
그러기에 앞서 Grafana 대시보드를 통해서 병목 (bottleneck) 여부를 판단하는 방법을 알아보겠습니다
## grafana 대시보드를 띄워주세요
istioctl dashboard grafana
11.2 컨트롤 플레인 모니터링 하기
istiod 는 컨트롤 플레인의 상황을 진단할 수 있는 다양한 메트릭을 제공합니다.
앞서 Observability 챕터에서도 컨트롤 플레인의 메트릭들을 살펴 보았는데요
메트릭이 워낙 다양하고 많기 때문에 어디에 중점을 두고 보아야 할 지 고민스러울 수 있습니다.
그래서 준비했습니다.
시스템 운영 및 모니터링에서 중요한 지표를 정리한 “four golden signals” 관점에서 컨트롤 플레인의 모니터링 지표들을 설명해 보도록 하겠습니다
실습 준비
catalog 를 배포합니다 - istio-ingressgateway 로 부터 catalog.istioinaction.io:80 호출을 허용합니다
kubectl -n istioinaction apply -f services/catalog/kubernetes/catalog.yaml
kubectl -n istioinaction apply -f ch11/catalog-virtualservice.yaml
kubectl -n istioinaction apply -f ch11/catalog-gateway.yaml
11.2.1 컨트롤 플레인의 4 Golden Signals
4 Golden Signals ~ latency, saturation, errors, traffic
kubectl exec -it -n istio-system deploy/istiod -- curl localhost:15014/metrics
LATENCY: 데이터 플레인의 업데이트 시간 지연
레이턴시는 엔드유저 시각에서 서비스 성능에 대한 외적인 뷰를 제공합니다
Latency
- End user 의 시각 : “느리다” ⇒ “성능이 안좋다” (Latency)
- 그런데, 왜 느릴까? 성능저하(degradation)를 야기하는건 무엇일까? 는 안알랴줌 ~ >.,<
- Latency (지연) 만 가지고는 원인을 알 수 없어요 ⇒ 다른 signal 도 함께 살펴봐야 합니다
컨트롤 플레인은 데이터 플레인에 업데이트를 배포하는데 걸리는 레이턴시를 측정합니다
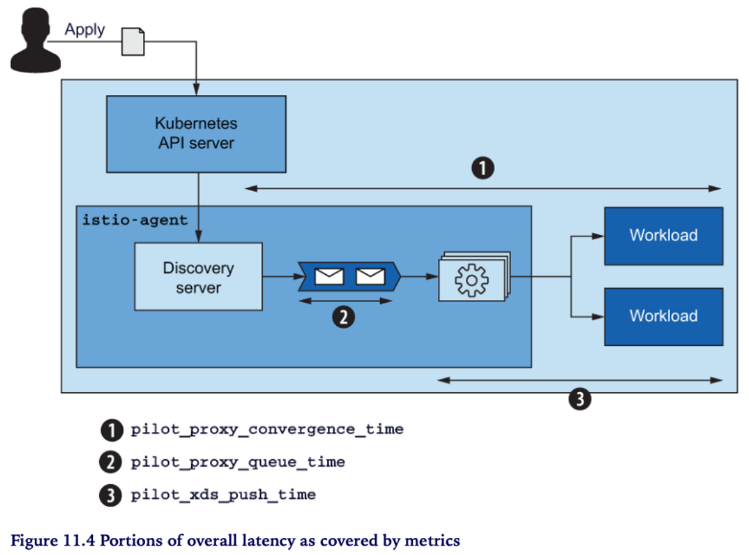
pilot_proxy_convergence_time
histogram_quantile(0.5, sum(rate(pilot_proxy_convergence_time_bucket[1m])) by (le))
histogram_quantile(0.9, sum(rate(pilot_proxy_convergence_time_bucket[1m])) by (le))
histogram_quantile(0.99, sum(rate(pilot_proxy_convergence_time_bucket[1m])) by (le))
histogram_quantile(0.999, sum(rate(pilot_proxy_convergence_time_bucket[1m])) by (le))
pilot_proxy_queue_time 👈🏻 (실습) 그라파나 대시보드에 추가해 보세요
histogram_quantile(0.5, sum(rate(pilot_proxy_queue_time_bucket[1m])) by (le))
histogram_quantile(0.9, sum(rate(pilot_proxy_queue_time_bucket[1m])) by (le))
histogram_quantile(0.99, sum(rate(pilot_proxy_queue_time_bucket[1m])) by (le))
histogram_quantile(0.999, sum(rate(pilot_proxy_queue_time_bucket[1m])) by (le))
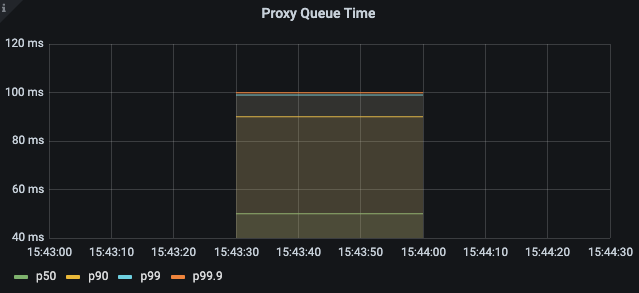
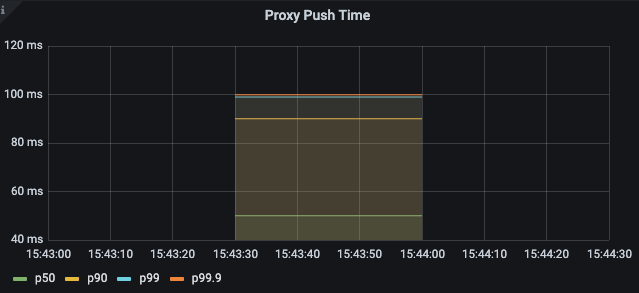
히스토그램이 앞의 Proxy Push Time 과 비슷
pilot_xds_push_time 👈🏻 (실습) 그라파나 대시보드에 추가해 보세요
histogram_quantile(0.5, sum(rate(pilot_xds_push_time_bucket[1m])) by (le))
histogram_quantile(0.9, sum(rate(pilot_xds_push_time_bucket[1m])) by (le))
histogram_quantile(0.99, sum(rate(pilot_xds_push_time_bucket[1m])) by (le))
histogram_quantile(0.999, sum(rate(pilot_xds_push_time_bucket[1m])) by (le))
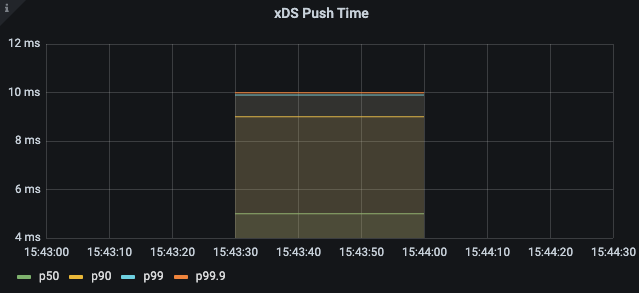
99분위수 10ms 이내
메시에 워크로드들이 추가될 수록 살펴본 메트릭들의 레이턴시는 점진적으로 증가합니다
약간의 증가에 대해서는 우려할 필요는 없겠지만, 수용가능한 레이턴시 수준에 대한 스레숄드를 정하고 이를 초과하는 경우에는 알람을 발생하도록 합니다 (아래는 권장 사항)
- Warning - 10초 이상 동안 레이턴시가 1초를 초과하는 경우
- Critical - 10초 이상 동안 레이턴시가 2초를 초과하는 경우
처음 알람을 받았을 때 당황할 필요는 없습니다; 단지 서비스 레이턴시가 증가했고 성능 최적화가 필요하다는 신호입니다. 하지만, 확인하지 않고 방치한다면 추가적인 성능저하로 엔드유저가 영향을 받게 될 수 있습니다.
레이턴시는 컨트롤 플레인의 성능저하를 나타내는 가장 좋은 indicator 입니다. 그렇지만 성능저하의 근본적인 원인을 알 수 있는 추가적인 인사이트를 제공해 주지는 않습니다.
SATURATION: 컨트롤 플레인의 리소스 여유는 ?
“saturation”은 사용중인 리소스의 사용률(utilization)을 보여줍니다.
리소스 사용률이 90%이상일 경우, 서비스는 “포화상태”(saturated)에 이르게 됩니다. istiod 가 포화되면, 푸시 요청이 오랫동안 큐잉되면서 처리를 기다리게 되고 이에 따라 업데이트의 배포 (distribution updates) 가 느려지게 됩니다
“Saturation” 은 대부분 가장 제한된(부족한) 리소스에 의해 발생합니다. istiod 는 CPU intensive 하기 때문에 CPU가 가장 먼저 포화상태에 이르게 됩니다.
CPU utilization 을 나타내는 메트릭은 다음과 같습니다
container_cpu_usage_seconds_total~ 쿠버네티스 컨테이너에서 집계된 CPU 사용률process_cpu_seconds_total~ istiod 계측에 의해 집계된 CPU 사용률
컨트롤 플레인이 포화상태에 도달하면 리소스 부족에 따라 추가적인 리소스 할당을 얼마나 해야 할 지도 고려해야 하는데요.
우선은, 컨트롤 플레인의 동작을 최적화 하는 방향으로 먼저 시도해 보고난 후에 그래도 개선이 되지 않는 경우에는 추가적인 리소스 할당이 최선의 선택일 수 있습니다 “선최적화 후리소스”
When the control plane is saturated, it is running short on resources, and you should reconsider how much is allocated. If you’ve tried other approches to optimize the behavior of the control plane, increasing resources may be the best option.
TRAFFIC: 컨트롤 플레인의 부하는 ?
트래픽은 시스템의 부하상황을 측정합니다
예를 들어, 웹어플리케이션의 경우에는 부하(load)는 초당 요청수 (rps, requests per second)로 정의됩니다.
반면, Istio 컨트롤 플레인의 경우에는 들어오는 (incoming) 트래픽과 나가는 (outgoing) 트래픽 모두를 고려해야 합니다
incoming 트래픽
- Config Change 에 따른 이벤트 유입
outgoing 트래픽
- 데이터 플레인으로 업데이트 Push
성능을 제한하는 요인을 찾기 위해서는 양쪽 트래픽을 모두 측정할 필요가 있는데요. 이에 기반하여 성능 향상을 위해 방향별 접근이 필요합니다
incoming 트래픽 메트릭
pilot_inbound_updates: istiod 로 인입되는 초당 설정 업데이트 수pilot_push_triggers: 푸시로 트리거되는 이벤트 총개수. 푸시 트리거 이벤트 유형 ~ service, endpoint, config (Gateway, Virtual Service, …)pilot_services: pilot 이 관리하는 서비스 개수.- more services, more processing (유입이벤트에 대해 Envoy 컨피그를 생성)
- incoming 트래픽에 기인한 istiod의 부하상황을 보여주는 중요한 지표
outgoing 트래픽 메트릭
-
pilot_xds_pushes: 컨트롤 플레인에서 만들어지는 모든 푸시 유형 측정 ~ listener, route, cluster, endpoint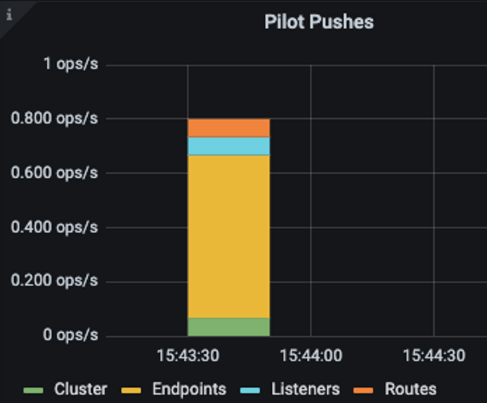
-
pilot_xds: pilot 인스턴스 당 관리하는 워크로드 커넥션 개수
-
envoy_cluster_upstream_cx_tx_bytes_total: Config 사이즈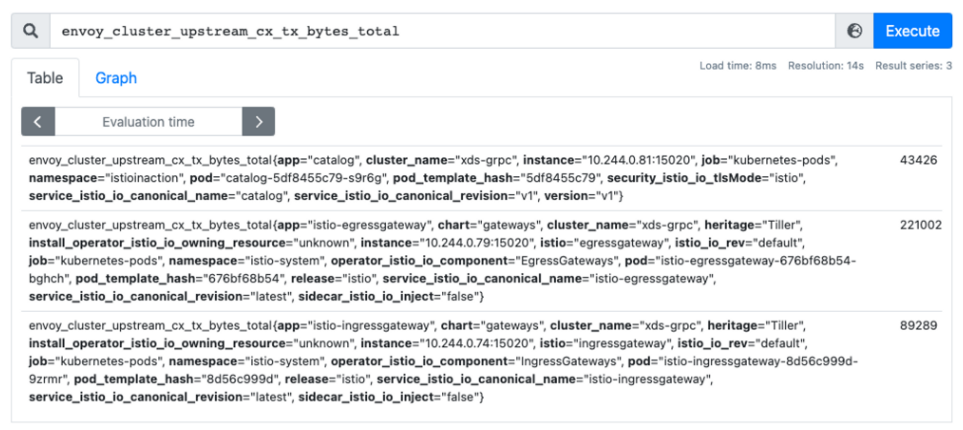
incoming / outgoing 트래픽 구분은 포화의 원인과 가능한 대처방안 (mitigation paths)을 보다 명확하게 해줍니다
포화 상태의 원인이 incoming 트래픽인 경우
- 성능 병목은 변화율 (rate of changes)에 기인하고, 해결방법(resolution)은 이벤트 배치 처리를 늘리거나 혹은 스케일업 하는 것입니다
포화 상태의 원인이 outgoing 트래픽인 경우
- 해결방법은 컨트롤 플레인을 스케일아웃 하여 pilot 당 인스턴스(워크로드) 수를 줄여야 합니다 * pilot 은 워크로드를 관리하고 워크로드 별로 사이드카 리소스를 정의합니다
ERRORS: 컨트롤 플레인의 실패율은 얼마인가 ?
에러는 istiod의 실패율(failure rate)을 나타냅니다
에러는 서비스 포화 상태, 성능 저하 상황에서 항상 발생합니다.
컨트롤 플레인에서 “가장 중요한 에러 메트릭”은 다음과 같습니다
pilot_total_xds_rejects: 컨피그 푸시 reject 건 수pilot_total_xds_rejects의 서브셋 집계pilot_xds_eds_reject,pilot_xds_lds_reject,pilot_xds_rds_reject,pilot_xds_cds_reject
pilot_xds_write_timeout: 푸시 처리 중 에러/타임아웃 집계pilot_xds_push_context_errors: Envoy 컨피그 생성 중 pilot 에러 건 수 (대부분 bug 에 기인)
위의 메트릭들은 컨트롤 플레인의 상태에 대한 인사이트를 제공하고 얼마나 성능을 내고 있는지, 성능 병목을 밝혀낼 수 있도록 돕습니다.
11.3 성능 튜닝
컨트롤 플레인의 성능 요소
- the rate of changes
- the resources allocated to it
- the number of workloads it manages
- the configuration size pushed to those workloads
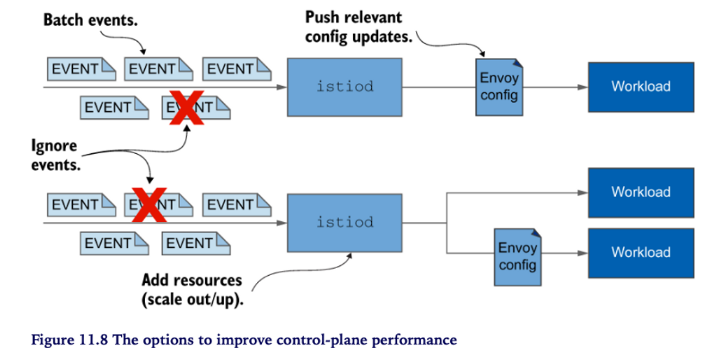
컨트롤 플레인 성능 조절하기
- Ignoring events
- Batching events
- Allocating additional resources by
- Scaling out ~ reduce the load by splitting the number of workloads managed
- Scaling up ~ speed up the generation of the Envoy configuration and enable the processing of more push requests concurrently
- Pushing only relevant updates
- Reduces the configuration size
- Reduces the number of proxies
11.3.1 실습 환경
더미 워크로드 10개 추가해 봅니다
kubectl -n istioinaction apply -f ch11/sleep-dummy-workloads.yaml
더미설정 600개 배포 합니다 (svc 200개, vs 200개, gw 200개)
kubectl -n istioinaction apply -f ch11/resources-600.yaml
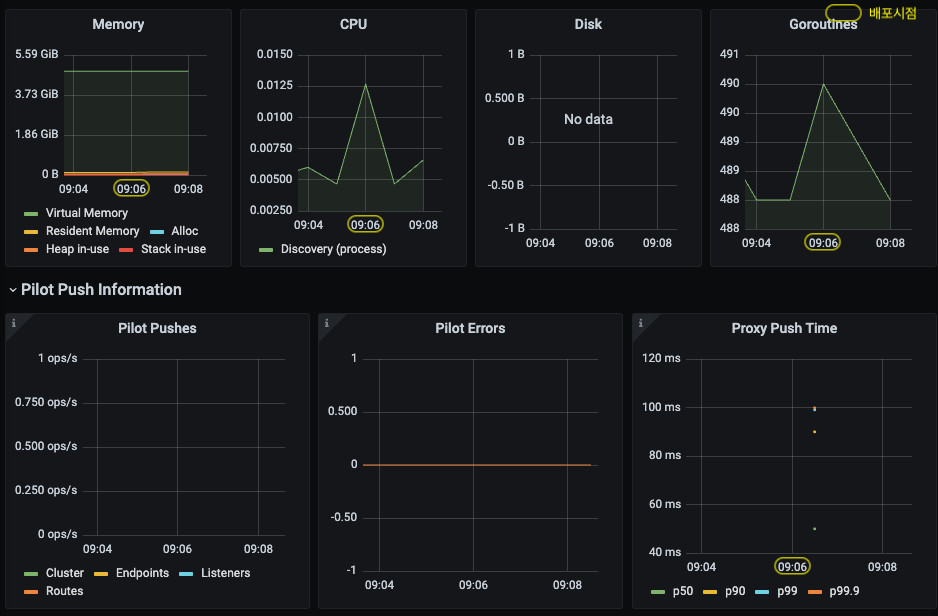
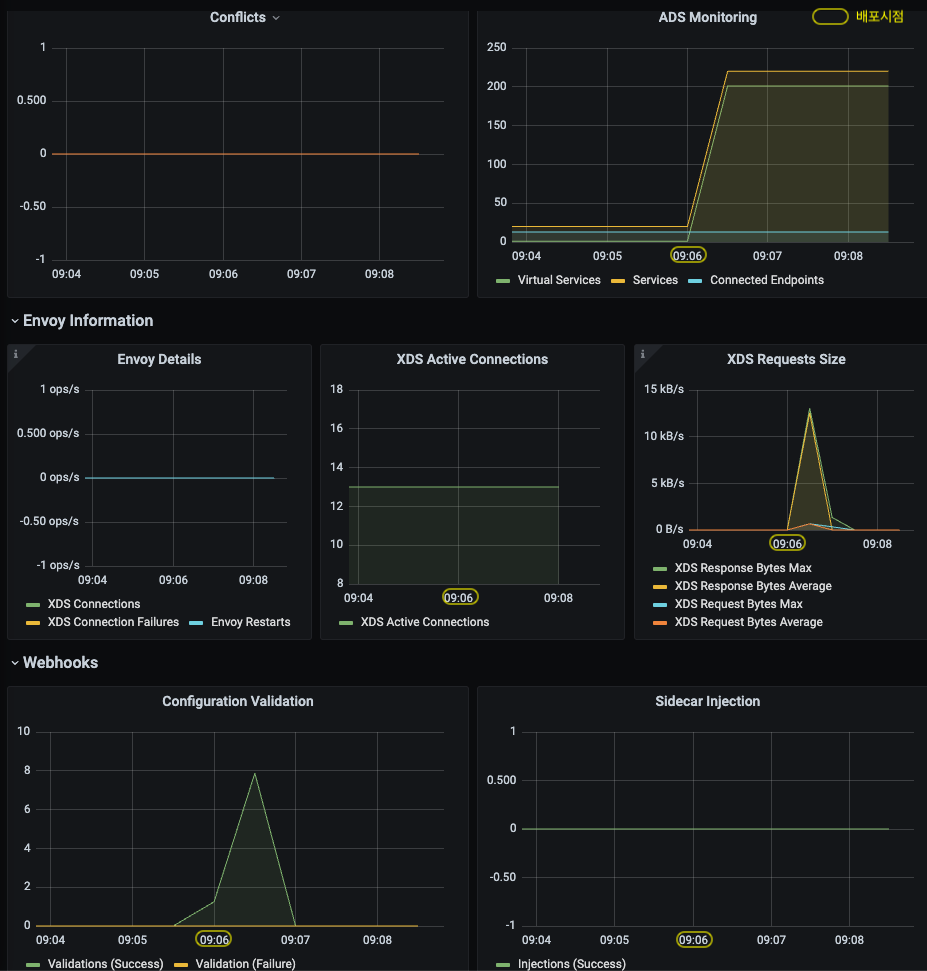
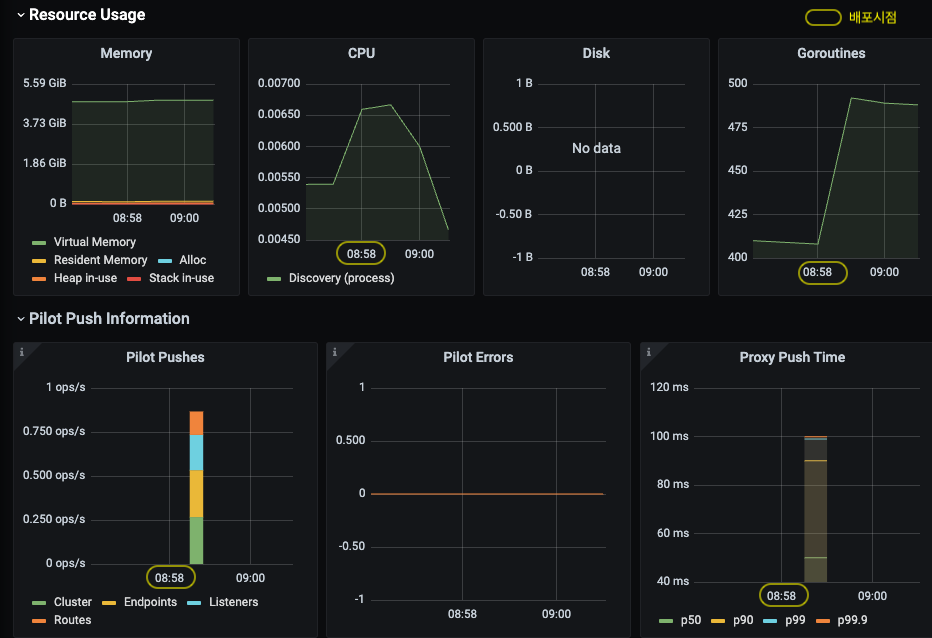
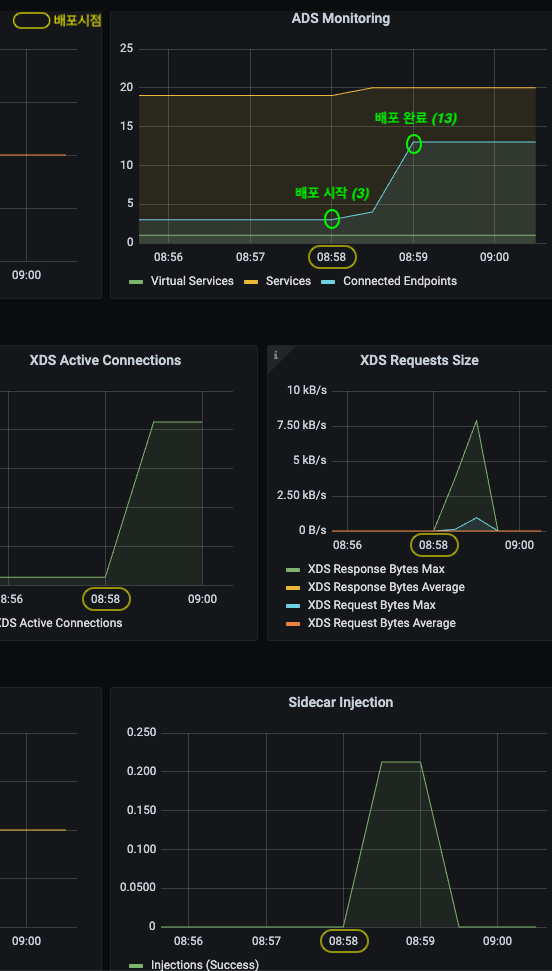
Push Latency 비교 - (좌) dummy 배포, (우) 600개 설정 배포
istiod 가 관리하는 워크로드의 총개수는 13개 (ingress/egress gateway 포함), Service, VirtualService, Gateway 설정 600개가 추가되었습니다.
⇒ 이로 인해 Envoy Configuration 을 생성하기 위한 처리량이 증가하였고, 워크로드에 푸시되는 configuration 사이즈가 (불필요하게) 커졌습니다 (bloats the config) .
11.3.2 성능 측정: 최적화 이전 상태
(실험설계) 컨트롤 플레인의 성능을 측정합니다
- service 생성을 반복하여 부하를 발생시키고
- config 업데이트를 프록시로 배포하기 위한
- 푸시수와 레이턴시(99분위수)를 측정합니다
We’ll determine the control-plane performance with a test that generates load by creating services repeatedly and then measures both the number of pushes and the 99th percentile (P99) latency to distribute the configuration updates to the proxies.
bin/performance-test.sh --reps 10 --delay 2.5 \
  --prom-url prometheus.istio-system.svc.cluster.local:9090
Poor Man’s Performance Test creates Services, Gateways and VirtualServices and measures Latency and Push Count needed to distribute the updates to the data plane.
--repsThe number of services that will be created. E.g. –reps 20 creates services [0..19]. Default ‘20’--delayThe time to wait prior to proceeding with another repetition. Default ‘0’--prom-urlPrometheus URL to query metrics. Defaults to ‘prom-kube-prometheus-stack-prometheus.prometheus:9090’--gatewayURL of the ingress gateway. Defaults to ‘localhost’--namespaceNamespace in which to create the resources. Default ‘istioinaction’
## 출력
..
<생략>
==============
Push count: 514
Latency in the last minute: 0.0990 seconds
컨피그 사이즈 및 푸시 개수 줄이기
Sidecar 커스텀 리소스 설정 ~ 컨피그 사이즈와 Push count 줄이기
컨피그 사이즈 측정
CATALOG_POD=$(kubectl -n istioinaction get pod -l app=catalog -o jsonpath={.items..metadata.name} | cut -d ' ' -f 1)

kubectl -n istioinaction exec -ti $CATALOG_POD -c catalog -- curl -s localhost:15000/config_dump > /tmp/config_dump

du -sh /tmp/config_dump
2.3M /tmp/config_dump
“2.0M” (2메가) 정도 출력될 것입니다. 워크로드 당 컨피그 사이즈가 2메가 라고 하면 중간규모의 클러스터의 경우 워크로드 수가 대략 200개 수준에서 전체 Envoy 컨피그 크기는 400메가 입니다. 컨피그 사이즈가 커질수록 컨피그가 저장된 사이드카 프록시 마다 컴퓨팅 파워, 네트웍 대역폭, 메모리를 더 필요로 하게 됩니다
Sidecar 커스텀 리소스
“Envoy Config.” 사이즈를 줄여보자
이러한 문제점을 해결하기 위해, 사이드카 프록시의 inbound/outbound 트래픽 설정을 세부 조절할 수 있는 “Sidecar” 커스텀 리소스를 사용할 수 있습니다 .
Sidecar 설정 예시
apiVersion: networking.istio.io/v1beta1
kind: Sidecar
metadata:
  name: default
  namespace: istioinaction
spec:
  workloadSelector:
    labels:
      app: foo
  egress:
  -hosts:
   - "./bar.istioinaction.svc.cluster.local"
   - "istio-system/*"
workloadSelector~ limits the workload to which the sidecar configuration 설정을 적용할 workload를 제한합니다ingress~ specifies the handling of inbound traffic to the application 애플리케이션으로 들어오는 트래픽에 대한 처리방법을 정의합니다. If omitted, Istio configures the service proxy automatically by looking up the Pod definition. 생략할 경우에는 Istio는 Pod 정의에 따라 사이드카를 설정합니다.egress~ specifies the handling of the application’s outbound traffic to an external service through the sidecar. 사이드카를 통해서 외부서비스로 나가는 트래픽에 대한 처리방법을 정의합니다. If omitted, the configuration inherits the egress configuration from a more generic sidecar, if present; otherwise, it falls back on the default behavior of configuring access to all other services. (생략 시, 상속 or default 로 동작)outboundTrafficPolicy~ specifies the mode for handling outbound trafficREGISTRY_ONLYALLOW_ANY
Sidecar 커스텀 리소스를 설정하면 개별 프록시별로 관련된 컨피그만 식별하여 업데이트를 보내게 됩니다. 따라서 모든 컨피그를 생성해서 모든 사이드카로 일괄 배포하는 상황을 피할 수 있어 CPU, 메모리, 네트웍 대역폭 등의 리소스 낭비를 줄일 수 있습니다.
As a result, it avoids generating and distributing all the configurations on how to reach every other service, thus reducing CPU, memory, and network bandwidth consumption.
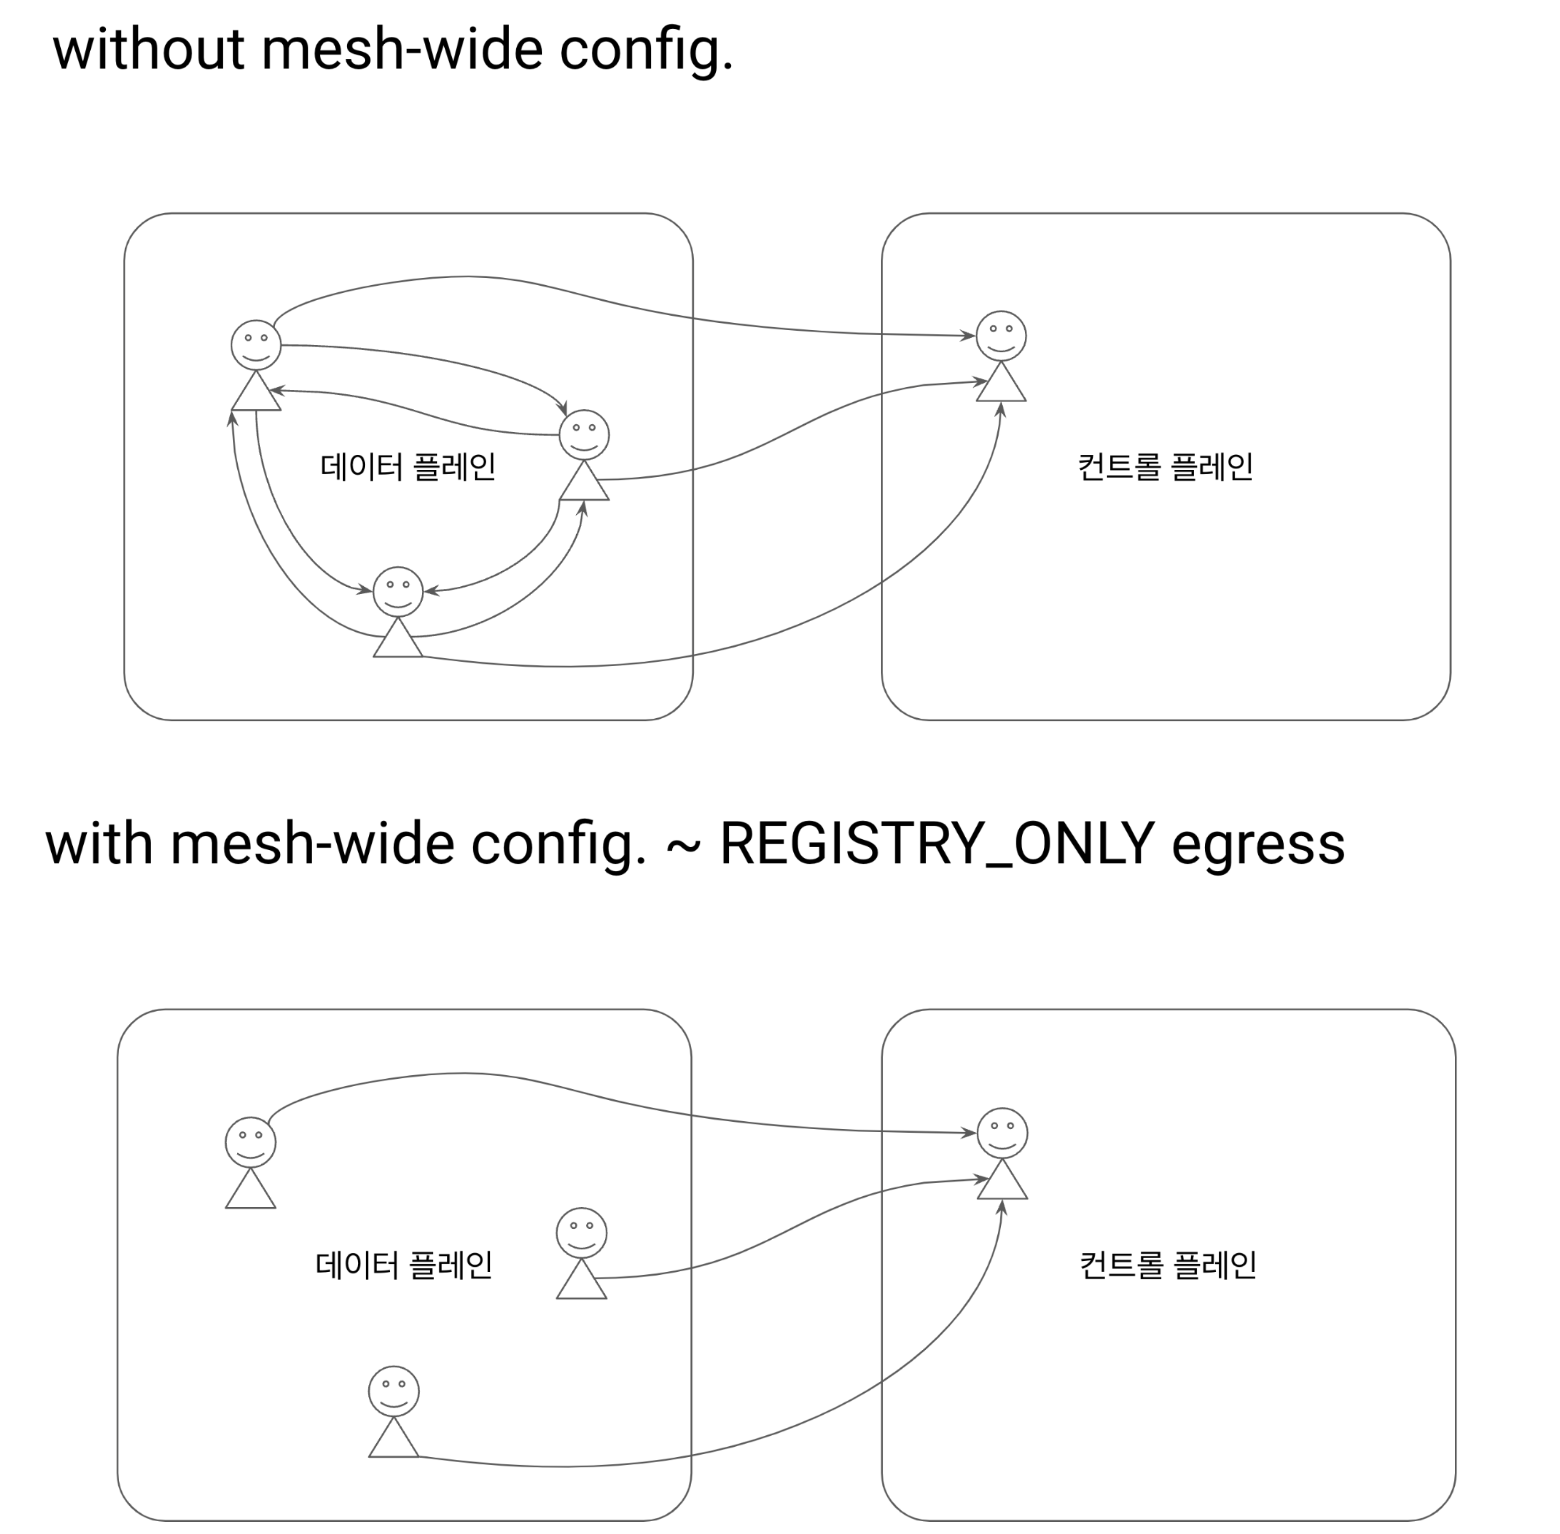
mesh-wide Sidecar 설정
“디폴트 설정 (mesh-wide) 을 하자 ~ Sidecar 명세”
egress 설정 제한 ~ 컨트롤 플레인 등 기본 egress 설정을 한정 Envoy 컨피그가 심플해짐 - istio-system 네임스페이스의 서비스로만 egress 설정이 추가됨
Define a mesh-wide sidecar configuration that permits egress traffic only to services in the istio-system namespaces. Defining such a default configures all proxies in the mesh with the minimal configuration to connect only to the control-plane and drops all configuration for connectivity to other services
apiVersion: networking.istio.io/v1beta1
kind: Sidecar
metadata:
  name: default
  namespace: istio-system   # mesh-wide scope
spec:
  egress:
  - hosts:
    - "istio-system/*"  # istio-system 네임스페이스
    - "prometheus/*"    # prometheus 네임스페이스
  outboundTrafficPolicy:
    mode: REGISTRY_ONLY     # 등록된 경우만 허용
- istio-system, prometheus 네임스페이스만 egress 허용
kubectl -n istio-system apply -f ch11/sidecar-mesh-wide.yaml
컨피그 사이즈 다시 확인
CATALOG_POD=$(kubectl -n istioinaction get pod -l app=catalog -o jsonpath={.items..metadata.name} | cut -d ' ' -f 1)

kubectl -n istioinaction exec -ti $CATALOG_POD -c catalog -- curl -s localhost:15000/config_dump > /tmp/config_dump

du -sh /tmp/config_dump
컨피그 사이즈가 2.0M에서 516K로 줄었습니다
516K /tmp/config_dump
다시 성능 측정을 해봅시다
bin/performance-test.sh --reps 10 --delay 2.5 \
  --prom-url prometheus.istio-system.svc.cluster.local:9090
..
<생략>
==============

Push count: 70  # <-- 514
Latency in the last minute: 0.0990 seconds # <-- 0.10 seconds
- Push count 와 Latency 모두 감소하였습니다
실습에서 mesh-wide 한 Sidecar 설정이 성능 향상에 얼마나 중요한지 알 수 있습니다.
더불어 …
- mesh 의 운영 cost를 절감하는데 도움이 됩니다
- 워크로드 별로 egress 트래픽을 명확하게 정의하는 것은 좋은 습관입니다
11.3.3 이벤트 무시하기: 필요한 이벤트만 watch 하자
“디스커버리 scope 을 줄이자 ~ IstioOperator meshConfig.discoverySelectors“
놀랍게도 모든 네임스페이스의 모든 이벤트를 watch 한다
As users move their services to run in the Istio service mesh, they are often surprised that the control plane watches and processes all of the Kubernetes resources, from all namespaces in the cluster, by default. 참고) https://istio.io/latest/blog/2021/discovery-selectors/
namespace-selector ~ Istio 1.10+
Istio의 watch 부담을 줄이자
apiVersion: install.istio.io/v1alpha1
kind: IstioOperator
metadata:
  namespace: istio-system
spec:
  meshConfig:
    discoverySelectors:
      - matchLabels:
          istio-discovery: enabled
apiVersion: install.istio.io/v1alpha1
kind: IstioOperator
metadata:
  namespace: istio-system
spec:
  meshConfig:
    discoverySelectors:
      - matchExpressions:
        - key: istio-exclude
          operator: NotIn
          values:
            - "true"
istioctl install -y -f ch11/istio-discovery-selector.yaml
kubectl label ns new-namespace istio-exclude=true
11.3.4 이벤트 batch 와 푸시 쓰로틀링 설정
batch 기간 늘리기
Push count 를 줄이기 위한 전략임 ⇒ 배치 기간 (PILOT_DEBOUNCE_AFTER) 동안 이벤트 merge 를 통해 중복을 최소화함으로써 큐에 push 되는 이벤트 개수를 줄임
환경변수
PILOT_DEBOUNCE_AFTERdebounce 이벤트 대기 시간 (기본값: 100ms)
예) 100ms (기본값) 이내에 새로운 이벤트가 없으면 queue에 추가하고, 있으면 merge 후 다시 100ms 동안 대기
단, 최대PILOT_DEBOUNCE_MAX이내에서 허용PILOT_DEBOUNCE_MAXdebouncing 최대 허용 시간 (기본값: 10초)PILOT_ENABLE_EDS_DEBOUNCE엔드포인트 업데이트의 debounce 여부 (기본값: true)PILOT_PUSH_THROTTLEistiod 가 처리하는 동시 푸시요청 수 (기본값: 100)
istioctl install --set profile=demo --set values.pilot.env.PILOT_DEBOUNCE_AFTER="2500ms"
# kubectl get deploy/istiod -n istio-system -o yaml

...
env:
...
- name: PILOT_DEBOUNCE_AFTER
  value: 2500ms
...
다시 성능 측정을 해봅시다
bin/performance-test.sh --reps 10 --delay 2.5 \
  --prom-url prometheus.istio-system.svc.cluster.local:9090
..
<omitted>
=====================

Push count: 63  # <-- 70
Latency in the last minute : 0.0990 seconds
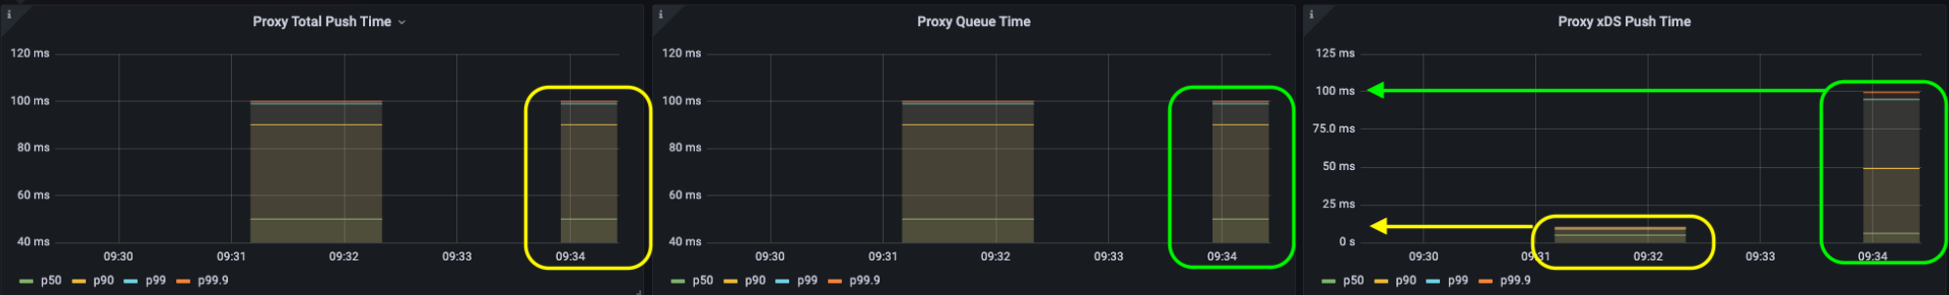
LATENCY 메트릭은 DEBOUNCE 기간을 포함하지 않아요 !
레이턴시는 push 큐 부터의 시간을 측정 ⇒ debounce 시간이 포함안됨 (아래 그림 참고)
(1) 전체 레이턴시 = (2) 큐 타임 + (3) 푸시 타임
- 디바운싱 기간 동안은 업데이트 (이벤트)가 전송되지 않음
- 따라서 결과적으로는 업데이트의 푸시 시간이 늘어났음에도 불구하고
- 레이턴시 메트릭 상에는 나타나지 않음 (debounce 기간이 레이턴시에 포함되지 않기 때문)
- 디바운싱으로 인한 레이턴시의 증가는 “stale configuration”, “low performance” 문제를 야기할 수 있음 ⇒ batch 설정 조정 시 약간씩만 조정할 것
- 데이터 플레인에서 흔히 엔드포인트 업데이트가 늦게 반영되는 경우가 있는데요
⇒
PILOG_ENABLE_EDS_DEBOUNCE설정을false로 하면 디바운싱으로 인해 엔드포인트 업데이트가 늦게 반영되지 않도록 디바운싱 단계를 skip 할 수 있음
컨트롤 플레인에 추가 리소스 할당하기
istioctl install --set profile=demo \
--set values.pilot.resources.requests.cpu=1000m \
--set values.pilot.resources.requests.memory=1Gi \
--set values.pilot.replicaCount=2
11.3 요약
-
Reducing Envoy configuration size : 불필요한 configuration 제거 ⇒ 필요한 configuration 명세(Sidecar 명세)
Sidecar configuration scopes
- mesh-wide (default)
- namespace-wide (default)
- workload-specific (overrides both mesh-wide and namespace-wide)
- Ignoring events : 불필요한 이벤트 제거 ⇒ 이벤트를 수신할 namespace 를 제한 (discoverySelector)
- Event-batching : 이벤트를 모아서 처리 ⇒ Envoy config. 개수를 줄인다 ⇒ Push 건 수를 줄인다
- Push-throttling :
- Scale-out : workloads 를 나눠서(splitting) 처리
- Scale-up : Pilot 에 리소스(cpu/mem)를 더 할당하여 처리량을 늘린다
11.4 성능 튜닝 가이드
Istio 는 성능이 뛰어납니다
Single Istio Pilot 1.13.4 (1 vcore / 1.5GB memory)
- 1,000 Kubernetes services
- 2,000 workloads (sidecars)
- 70,000 rps
production 권장 스펙 : 2x vCPUs / 2GB /w 3 replicas
컨트롤 플레인 튜닝 가이드
- 성능 이슈
- 데이터 플레인과 컨트롤 플레인 간의 연결 확인
- kube-apiserver 등 플랫폼 이슈 확인
Sidecar리소스 확인 (scope별)
- 병목 식별
- 메트릭 확인
- 4 Golden Signals (Latency, Saturation, Error, Traffic)
- 예1) 레이턴시는 높은데 리소스는 여유 ⇒ push concurrency ↑
- 예2) 부하(bursty, event spikes) 시 리소스 부족
- ⇒ istiod 개수 ↑
- ⇒ 배치 (debounce) period ↑
- 점진적 설정
- debounce period 조정은 stale configuration 야기할 수 있으므로
- 10 ~ 30% 사이에서 미세조정 하고
- 일정기간(1~2일) 모니터링을 통해 변화를 확인하면서
- 점진적으로 설정값을 늘리거나 줄일 것
- 안전 우선
- istiod (Istio Pilot) 는 전체 메시의 네트웍을 관리하므로
- 다운타임 발생 시 통신 중단을 발생할 수 있음
- 2개 이상 리플리카를 유지하고
- 안전 우선으로 보수적으로 운영할 것
- Burstable QoS
- istiod 가 항시 cpu 리소스를 필요로 하지는 않으므로
- event spikes 상황 등 peak 시 burstable 하게 리소스를 요구하는 특징을 가짐
Summary
- 컨트롤 플레인의 Primary Goal 은 데이터 플레인 싱크를 최신 (disired state) 으로 유지하는 것임
- Istiod 의 성능에 영향을 주는 요소들은 다음과 같음
- 변화율, the rate of changes
- 리소스, the resources allocated to the istiod
- 워크로드 수, the workload count istiod manages
- 컨피그 사이즈, the configuration size
- 쿠버네티스 등 플랫폼에서 발생하는 이벤트에 따른 변화율은 제어할 수 없지만
- 이벤트 배치 처리 시간(debounce period)을 정의하고, 데이터 플레인을 업데이트하는 작업량을 줄이는 것은 할 수 있음
Sidecar커스텀 리소스 설정 (Scope 고려)- 이벤트별 대상 워크로드 식별
- Envoy 컨피그 사이즈 절감
discovery selectorsistiod 에서 watch 할 네임스페이스 지정- watch event 절감
- Grafana Istio Control Plane 대시보드 활용 ~ 컨트롤 플레인 튜닝