Observability (관측가능성) 란 무엇이고, 모니터링과 어떻게 다를까요 ?
이번 챕터에서는 Observability의 개념을 알아보고 Istio 환경에서 Observability를 확보하는 방법들에 대해 알아 보겠습니다.
개요
- 클라우드, MSA 는 near-exponential (지수함수)에 가까운 복잡도(Complexity) 증가를 보입니다.
- Observability ~ Understanding “What’s really happening”
- 장애가 발생했을 때 빠르게 복구하기 위하여 꼭 필요합니다 (MTTR, 복구시간 단축)
- Istio는 Observability 를 위해 어플리케이션 네트워크 레벨의 metric 수집을 제공합니다.
- Istio가 제공하는 network metrics를 통해서 시각적으로 network call graphs 를 이해할 수 있습니다.
다루는 내용
- Observability 필요성
- Monitoring 이란
- Istio의 metric 수집
- Istio’s “Key metrics”
- Metrics-collection systems
- configure the proxies to report “more”
- control-plane metrics
- Customize metrics
실습환경
- minikube (k8s) 및 istio 설치. 참고: https://netpple.github.io/docs/istio-in-action/Istio-Environment
- 실습 네임스페이스 : istioinaction
- 실습 디렉토리 : book-source-code
7.1 What is observability?
Observability가 뭐에요?
- Observability 는 단지 보는 것만으로 (just by looking) 시스템의 “internal state”를 이해할 수 있는 수준의 “특징 (characteristic)” 임
- Observability 는 시스템의 “Runtime Control” 구현에 중요함
- “On the General Theory of Control System” (1960, Rudolf E. Kalman) 에서 최초로 언급됨
- Discern “When things are going wrong”
- wrong을 알려면 “well”을 정의하고 관찰(observe) 할 수 있어야 함 ”When things are going well”
- Implement the right levels of automated and manual controls to maintain this dynamic
- observe를 통해 문제(wrong)가 식별 (discern)되면 자동이든 수동이든 “제어”되도록 구현가능
- Istio는 application network level 의 observability를 제공함
- Istio만이 Observability를 제공하는 유일할 것은 아니며
- Observability는 application instrumentation, network instrumentation, signal collection infrastructure, databases 등 시스템의 다양한 레벨에서의 계측을 포함하고
- 예상치 못한 문제가 발생했을 때 방대한 데이터들에서 필요한 데이터를 선별하여 문제에 대한 전체적인 퍼즐을 짜맞추게 됩니다
7.1.1 observability vs. monitoring
모니터링 하고 어떻게 다른가요?
- monitoring is … “collecting” “aggregating” “matching” metrics, logs, traces, …
- monitoring is a subset of obsavability
- monitoring 은 metrics을 토대로 (known, 알려진) undesirable states를 watch 하고 알람을 전송함
- observability 는 시스템이 훨씬 더 unpredictable 하고 나아가 시스템에서 가능한 실패 전부를 알 수 없다고 가정함 (보다 현실적)
- 따라서 monitoring 보다 훨씬 더 많은 데이터를 필요로 함
- 예) monitoring 관점(system load, resources, traffics …)에서는 문제가 없지만 고객(Jone Doe)이 시스템 응답(10초)이 느리다고 느끼는 문제
- observability 관점에서는 (monitoring 보다) 더 많은 레이어들에서 데이터를 추출하고 고객 요청 (Jone Done)이 시스템으로 전달된 exact path 를 결정함
7.1.2 How Istio helps with observability
그래서 Istio는 observability 확보에 어떤 도움을 주나요?
- 앱 사이드의 서비스 프록시로써
- 서비스 간 request 경로 상에 위치하여
- request 핸들링이나 서비스 인터렉션과 관련된 메트릭들 (tps, latency, failures …)을 수집하고
- 새로운 메트릭을 추가하기도 합니다.
- 그리고, request 를 추적 (tracing) 하는데도 사용하는데요.
- 요청의 흐름에 어떤 서비스, 컴포넌트가 관여돼 있는지
- 각 노드에서 요청을 처리하는데 얼마나 소요 되는지 등을 확인하는데 도움이 됩니다.
- monitoring-tools 활용 : Prometheus, Grafana, Kiali , …
초기화
add-on 을 제거합니다.
이번 장에서는 앞의 2장에서 사용했던 (데모용도의) 모니터링 add-ons 를 제거하고 좀 더 실서비스에 가깝게 셋업해 보겠습니다.
cd istio-1.17.2

kubectl delete -f samples/addons/
istioinaction 네임스페이스 초기화
kubectl delete -n istioinaction \
deploy,svc,gw,vs,dr,envoyfilter --all
- deploy - deployment, svc - service, gw - gateway, vs -virtualservice, dr - destinationrule
7.2 Exploring Istio metrics
- data plane ~ handle requests
- control plane ~ configure data plane
- give insight (“what’s going on” at runtime) for application network
Let’s dig ! “What metrics are available for data/control plane”
7.2.1 Metrics in the data plane
Envoy can keep a large set of connection, request, and run-time metrics that we can use to form a picture of a service’s network and communication health.
지금 부터 실습을 통해서 Istio가 어떻게 application network 상의 metrics를 수집하여 explore, visualize 할 수 있는 영역으로 보내는지 살펴 봅니다.
실습은 실습 디렉토리 (book-source-code)와 실습 네임스페이스(istioinaction) 를 기준으로 합니다.
예제 앱 설치 및 네트워크 환경 설정
## catalog 앱 기동
kubectl apply -f services/catalog/kubernetes/catalog.yaml -n istioinaction

## webapp 앱 기동
kubectl apply -f services/webapp/kubernetes/webapp.yaml -n istioinaction

## gateway, virtualservice 설정
kubectl apply -f services/webapp/istio/webapp-catalog-gw-vs.yaml -n istioinaction
## 확인
kubectl get deploy,svc,gw,vs -n istioinaction -o name

deployment../catalog
deployment../webapp
service/catalog
service/webapp
gateway../coolstore-gateway
virtualservice../webapp-virtualservice
## 호출테스트
curl -H "Host: webapp.istioinaction.io" http://localhost/api/catalog

[{"id":1,"color":"amber","department":"Eyewear","name":"Elinor Glasses","price":"282.00"},{"id":2,"color":"cyan","department":"Clothing","name":"Atlas Shirt","price":"127.00"},{"id":3,"color":"teal","department":"Clothing","name":"Small Metal Shoes","price":"232.00"},{"id":4,"color":"red","department":"Watches","name":"Red Dragon Watch","price":"232.00"}]
첫번째로 sidecar proxy (istio-proxy) 의 메트릭을 확인해 봅시다.
배포한 앱의 Pod를 조회해 보세요. webapp, catalog 모두 sidecar proxy를 가지고 있습니다 (READY 항목, 컨테이너가 2개입니다)
## Pod 조회 - READY 항목을 보면 컨테이너가 2개씩 있습니다
kubectl get po -n istioinaction

NAME         READY   STATUS   ..
catalog-..   2/2     Running  ..
webapp-..    2/2     Running  ..
sidecar proxy 가 제공하는 메트릭을 확인해 보세요
## sidecar proxy (istio-proxy) 확인. '-c'옵션으로 컨테이너를 지정합니다
kubectl exec -it deploy/webapp -c istio-proxy \
-- curl localhost:15000/stats
## 출력 예시 ##
## 엄청나게 많은 메트릭 항목들이 쏟아집니다.
#...
wasmcustom.reporter=.=destination;.;source_workload=.=istio-ingressgateway;.;source_workload_namespace=.=istio-system;.;source_principal=.=spiffe://cluster.local/ns/istio-system/sa/istio-ingressgateway-service-account;.;source_app=.=istio-ingressgateway;.;source_version=.=unknown;.;source_canonical_service=.=istio-ingressgateway;.;source_canonical_revision=.=latest;.;source_cluster=.=Kubernetes;.;destination_workload=.=webapp;.;destination_workload_namespace=.=istioinaction;.;destination_principal=.=spiffe://cluster.local/ns/istioinaction/sa/webapp;.;destination_app=.=webapp;.;destination_version=.=unknown;.;destination_service=.=webapp.istioinaction.svc.cluster.local;.;destination_service_name=.=webapp;.;destination_service_namespace=.=istioinaction;.;destination_canonical_service=.=webapp;.;destination_canonical_revision=.=latest;.;destination_cluster=.=Kubernetes;.;request_protocol=.=http;.;response_flags=.=-;.;connection_security_policy=.=mutual_tls;.;response_code=.=200;.;grpc_response_status=.=;.;istio_requests_total: 5
#...
(참고) 컨테이너의 pilot-agent 를 이용해서도 동일하게 조회할 수 있습니다
kubectl exec -it deploy/webapp -c istio-proxy \
-- pilot-agent request GET /stats
kubectl exec -it deploy/webapp -c istio-proxy \
-- pilot-agent request GET /help

..
  /stats: print server stats
      usedonly: Only include stats that have been written by system since restart
      filter: Regular expression (Google re2) for filtering stats
      format: Format to use; One of (html, text, json)
      type: Stat types to include.; One of (All, Counters, Histograms, Gauges, TextReadouts)
      histogram_buckets: Histogram bucket display mode; One of (cumulative, disjoint, none)
..

## 필터 사용 예시1
kubectl exec -it deploy/webapp -c istio-proxy \
-- pilot-agent request GET /stats?filter=cluster.*.upstream_cx_total

## 필터 사용 예시2
kubectl exec -it deploy/webapp -c istio-proxy \
-- pilot-agent request GET /stats?filter=catalog.istioinaction
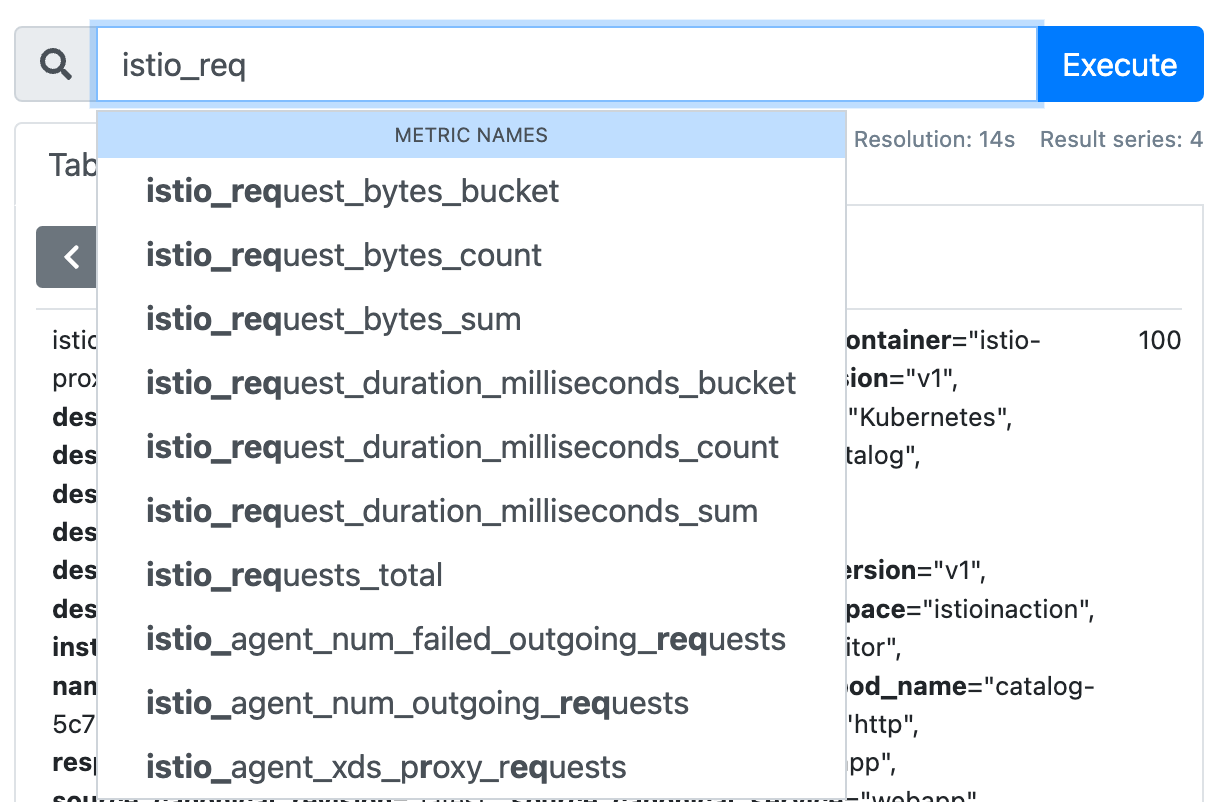
보시다시피 별도 설정없이도 풍부한 메트릭을 제공합니다.
- istio_requests_total
- istio_request_bytes
- istio_response_bytes
- istio_request_duration
- istio_request_duration_milliseconds
(참고) Istio가 제공하는 메트릭에 대한 내용은 Standard Istio Metrics 을 참고해주세요
- Metrics
- for HTTP,HTTP2,GRPC traffic
- Request Count
- Request Duration
- Request Size
- Respons Size
- gRPC Request Message Count
- gRPC Response Message Count
- for Tcp traffic
- Tcp Bytes Sent
- Tcp Bytes Received
- Tcp Connections Opened
- Tcp Connections Closed
- for HTTP,HTTP2,GRPC traffic
- Labels
Configuring proxies to report more Envoy Statistics
트러블 슈팅을 위해 envoy 상태정보를 추가하도록 설정해 봅니다.
webapp → catalog 호출 시 다양한 설정 (load balancing,security,circuit-breaking 등) 을 할 수 있는데요
webapp → catalog 호출에 대한 상세정보를 제공하도록 설정해 보겠습니다
두 가지 방법이 있습니다
방법1) default 설정 (IstioOperator 명세)
방법2) 워크로드 단위로 설정 (해당 워크로드 명세) <= “추천”
## 두번째 워크로드 명세 설정으로 해봅니다
# cat ch7/webapp-deployment-stats-inclusion.yaml
#...
spec:
  #...
  template:
    metadata:
      annotations:
        proxy.istio.io/config: |-
          proxyStatsMatcher:
            inclusionPrefixes:
            - "cluster.outbound|80||catalog.istioinaction"
#...
## 명세 적용
kubectl apply -n istioinaction -f \
ch7/webapp-deployment-stats-inclusion.yaml
## 호출테스트
curl -H "Host: webapp.istioinaction.io" http://localhost/api/catalog
## 메트릭 확인
kubectl exec -it deploy/webapp -c istio-proxy \
-- curl localhost:15000/stats | grep catalog
메트릭을 확인해 볼까요 (아까와 다르게 추가된 것이 있습니다)
바로~ catalog.istioinaction 에 대한 metrics 입니다
아래 metrics는 upstream 에 대한 커넥션 혹은 요청 시 circuit breaking 작동했는지를 나타냅니다.
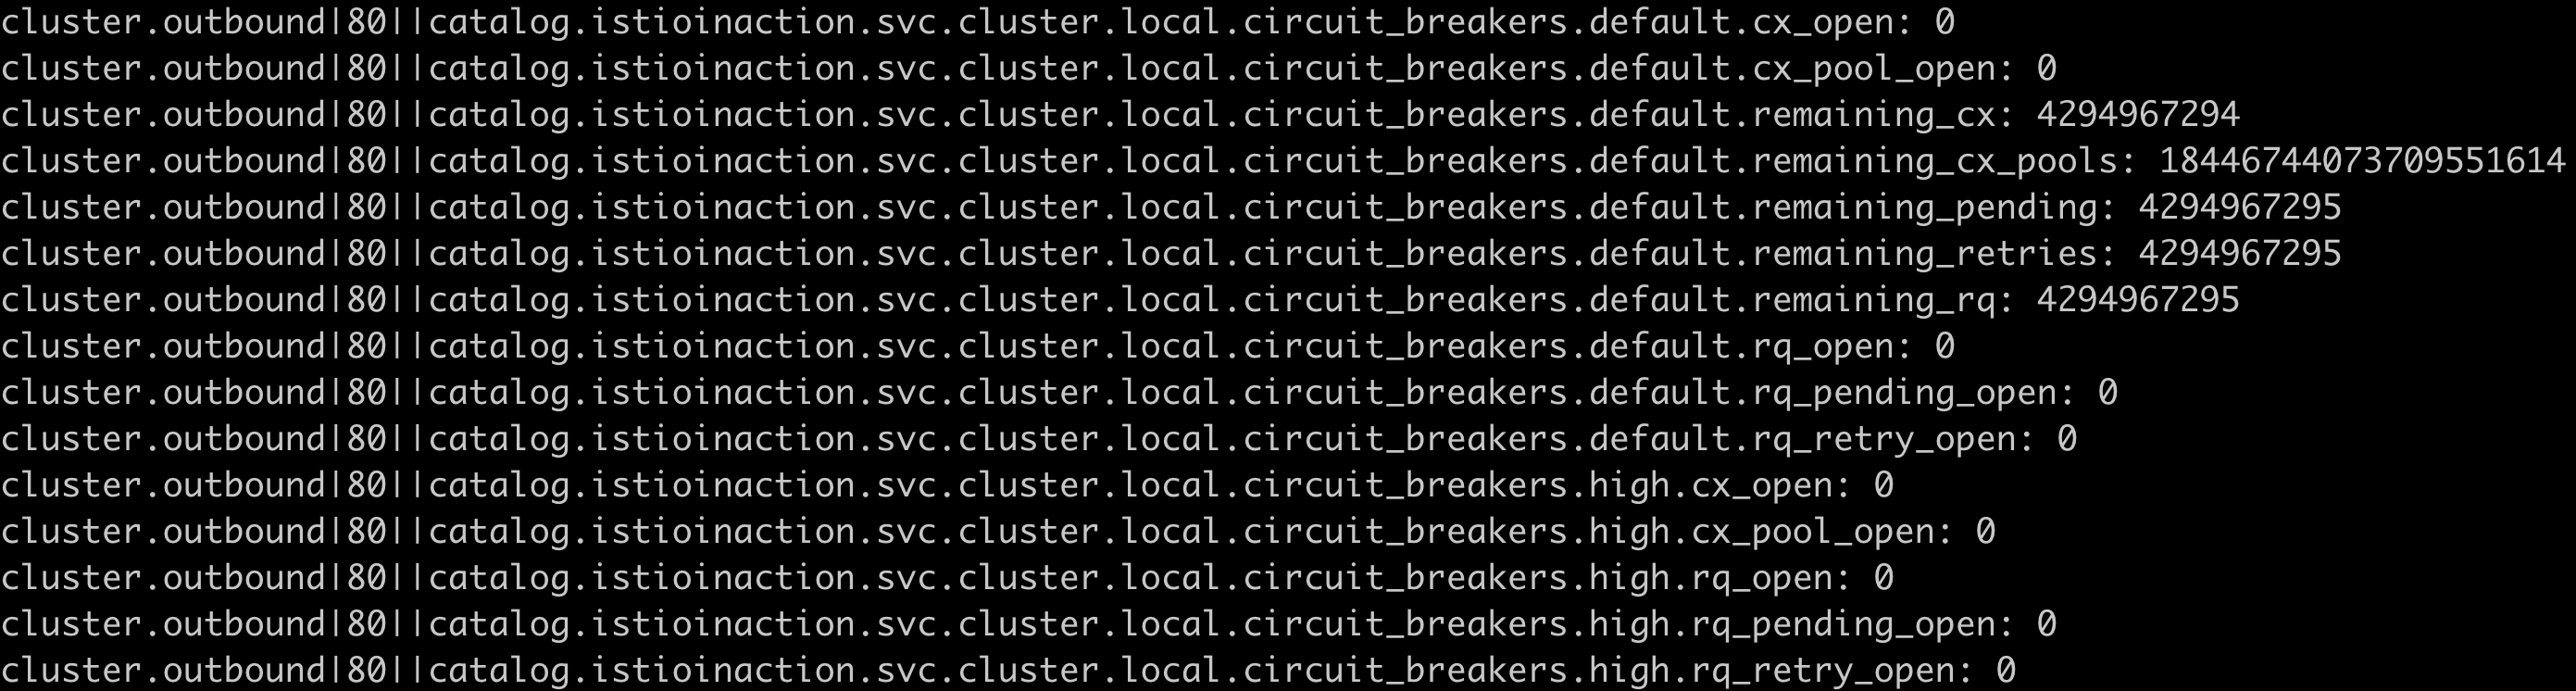
Envoy는 traffic을 식별할 때 internal origin 과 external origin 을 구분합니다.
-
internal origin: mesh 내부 트래픽 {cluster_name}.internal.
-
external origin: 밖에서 들어온 트래픽 (즉, ingress gateway를 통과)
upstream_cx, upstream_rq : upstream 연결과 요청에 대한 지표
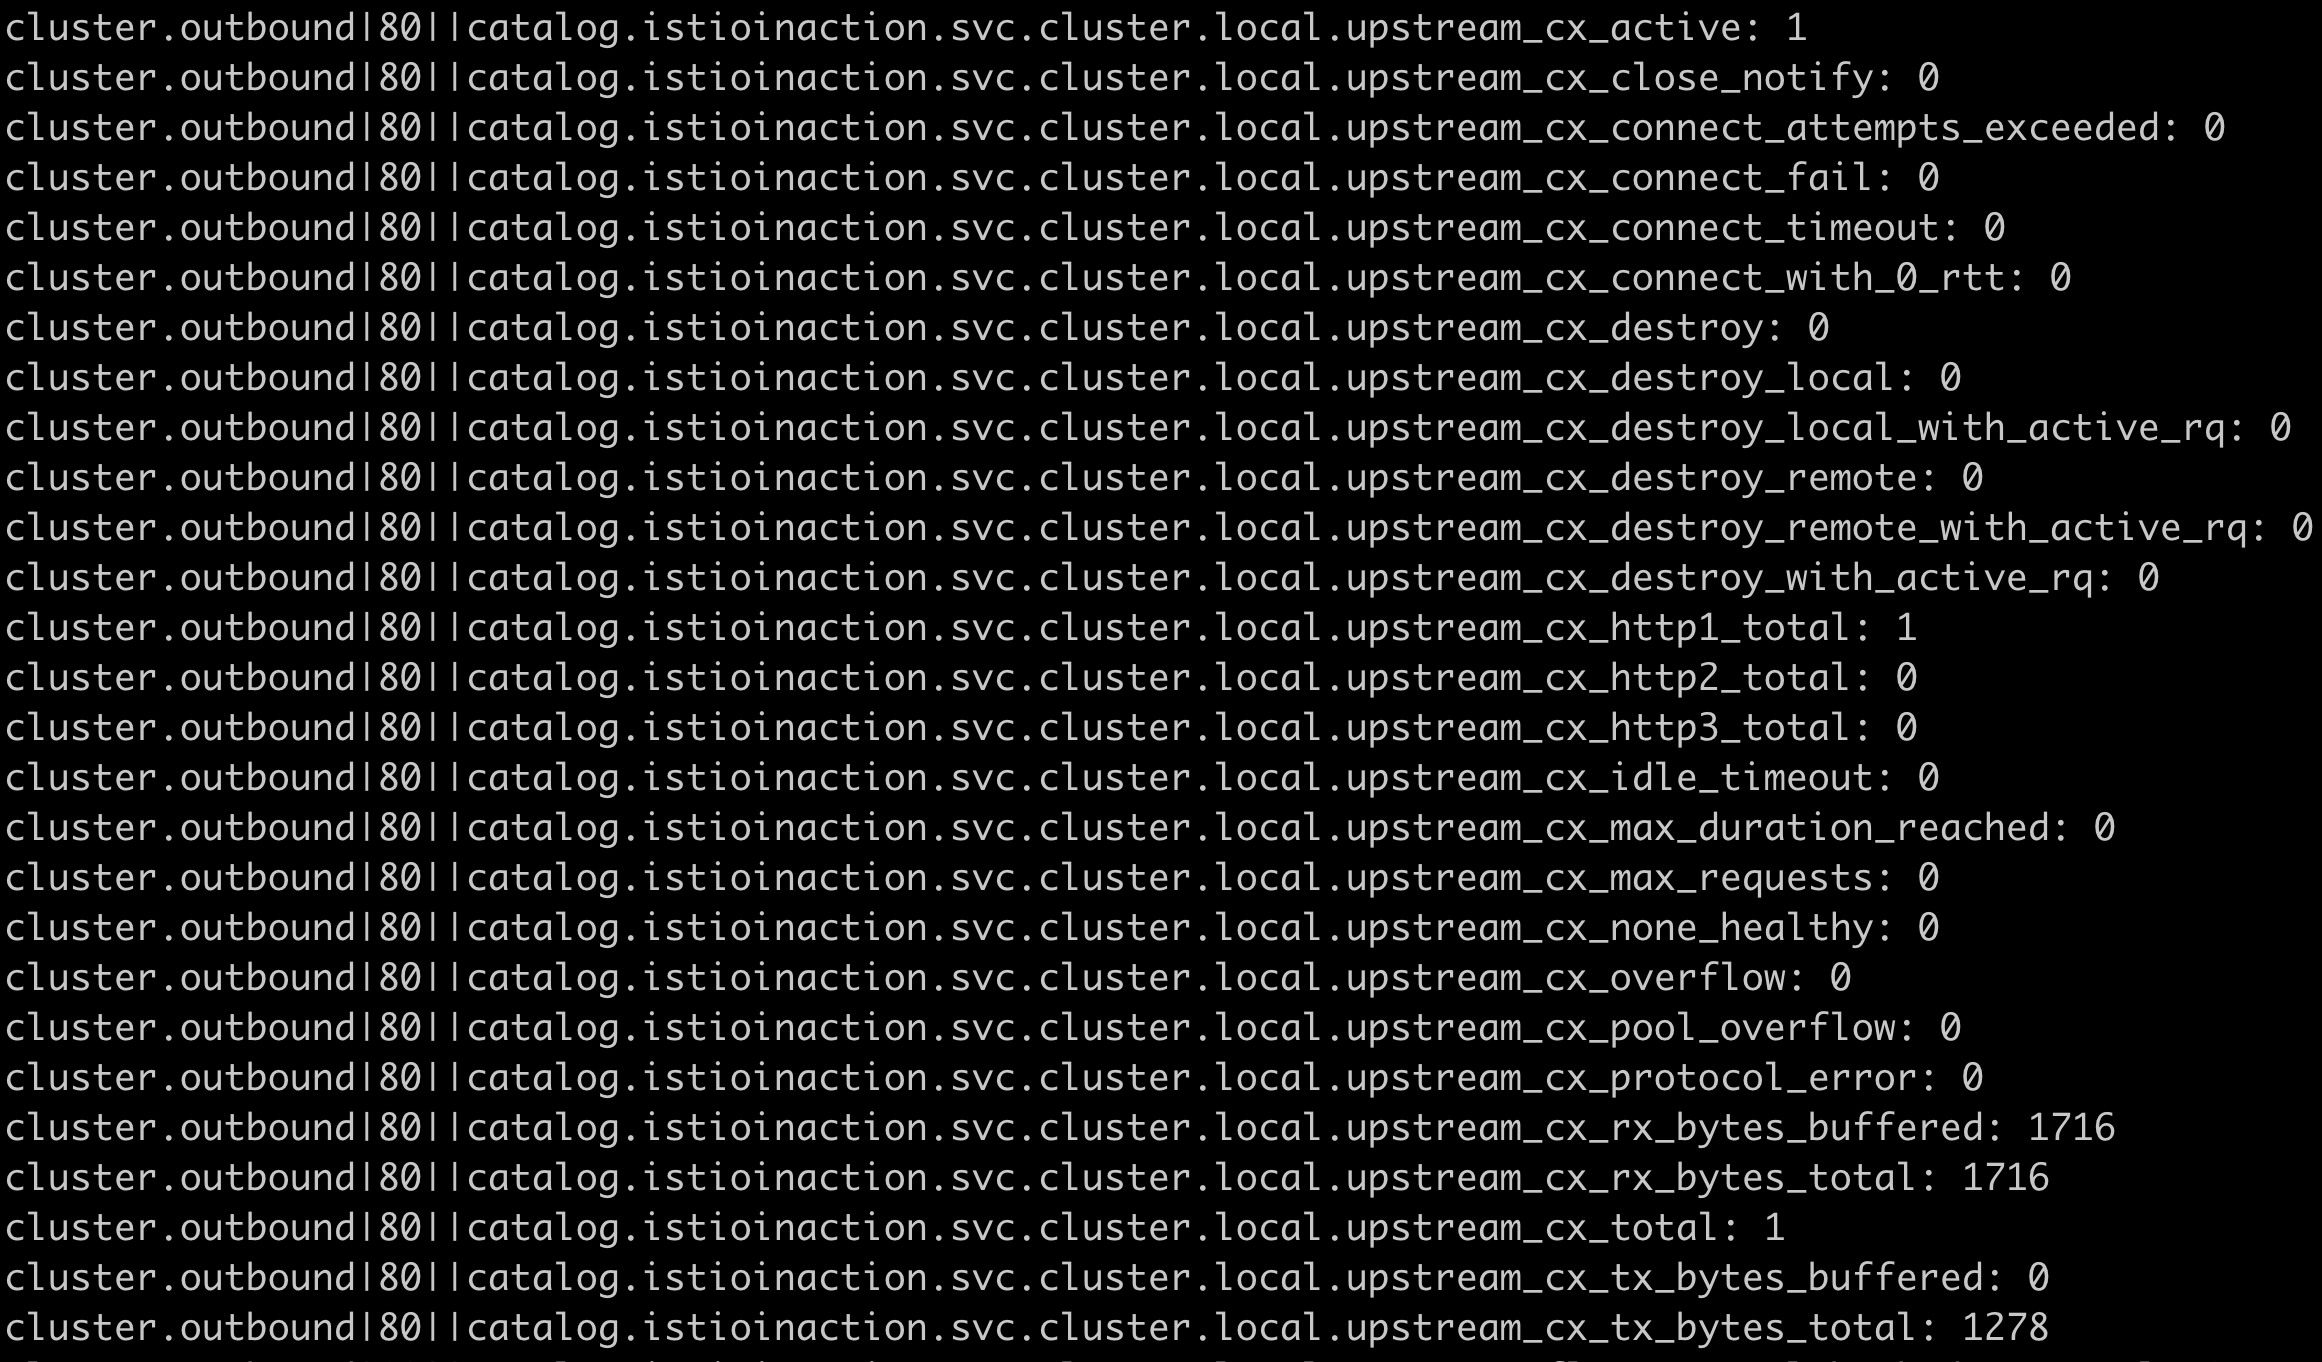
upstream_cx (connection) 정보
- …upstream_cx_overflow (ch6)
maxConnections초과 - …upstream_cx_pool_overflow (ch6)
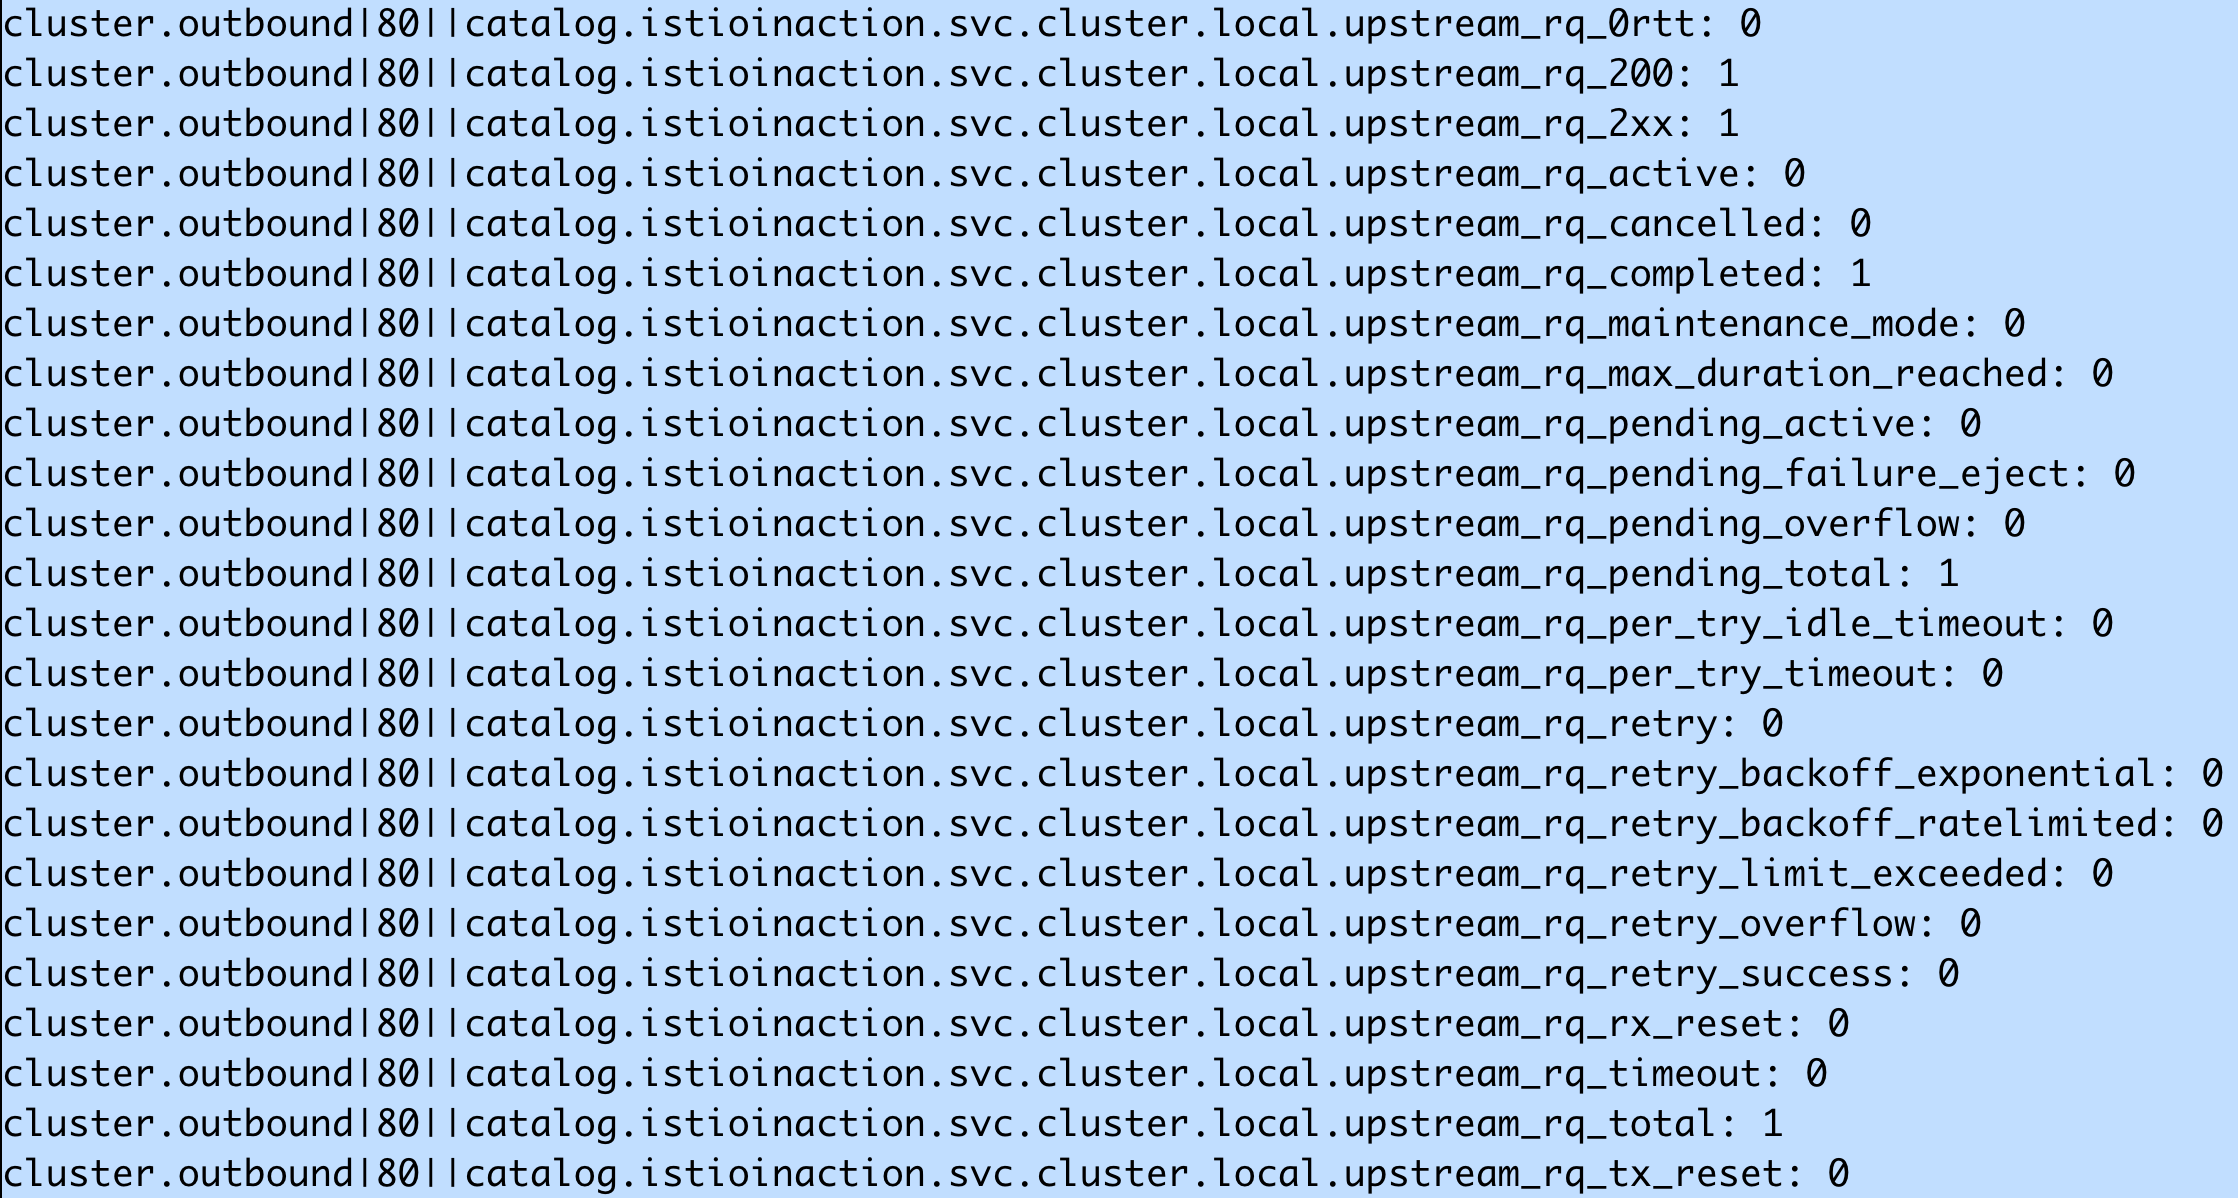
upstream_rq (request) 정보
- ..upstream_rq_pending_overflow (ch6)
http1MaxPendingRequests초과 - ..upstream_rq_retry_overflow (ch6)
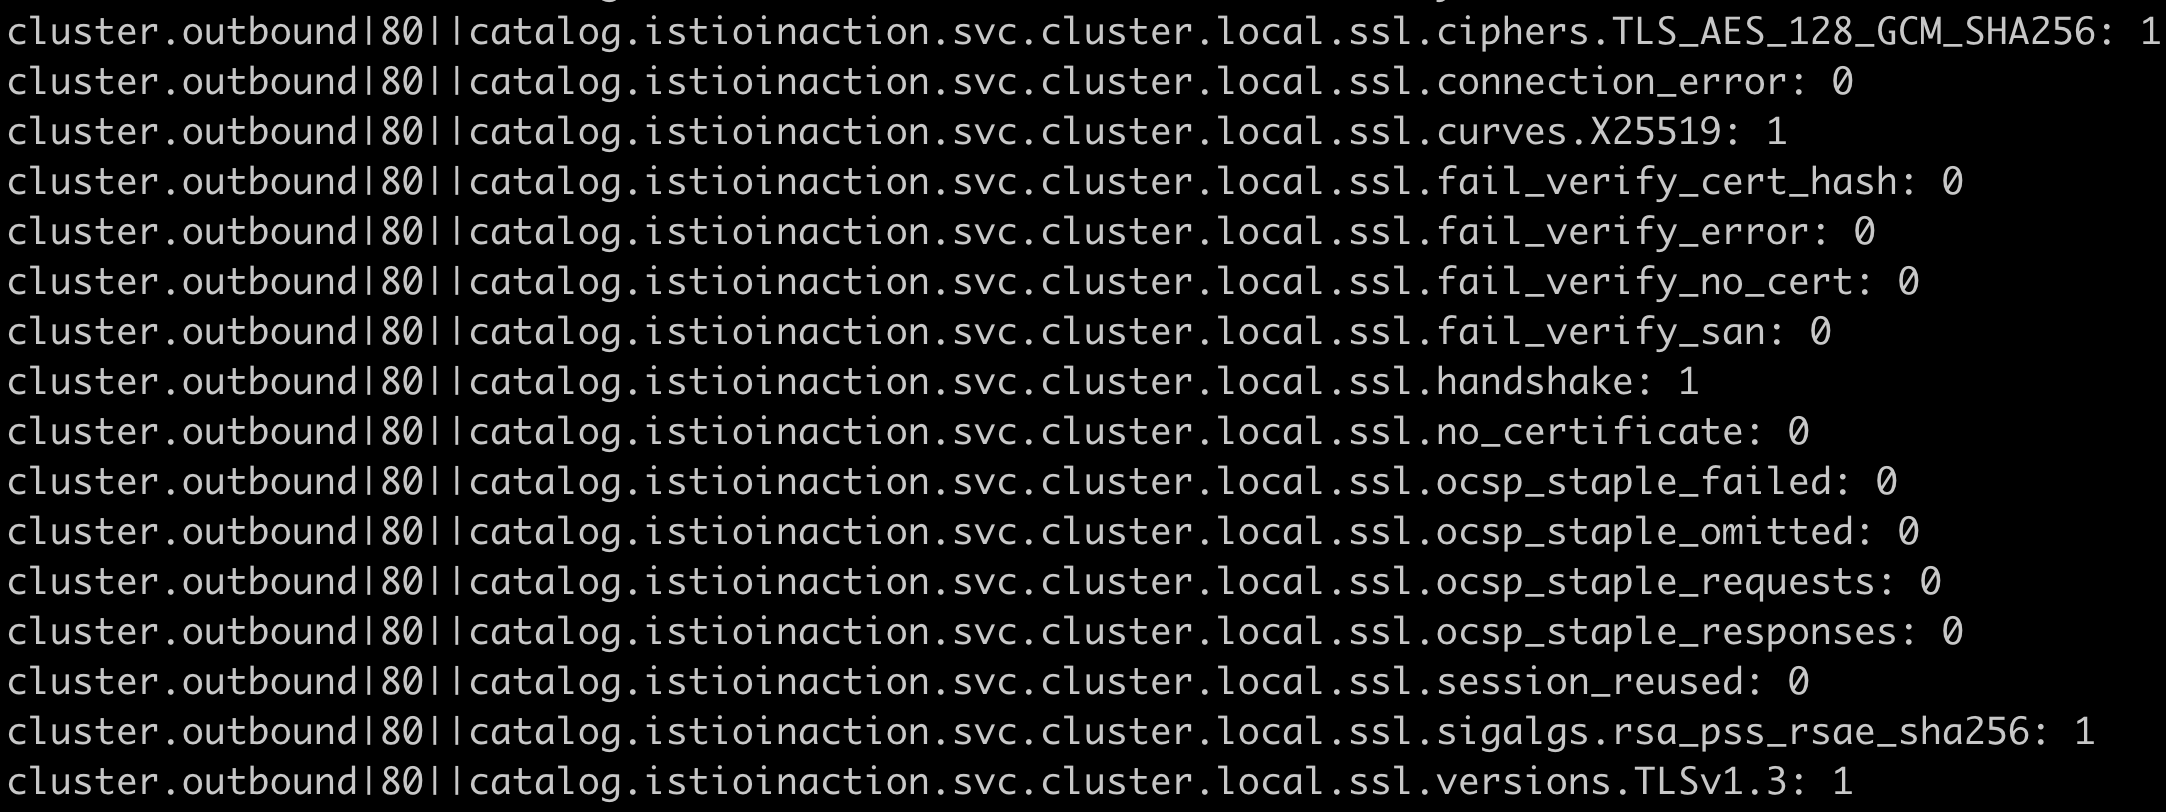
TLS traffic : {cluster_name}.ssl.
Load balancer 에 대한 지표
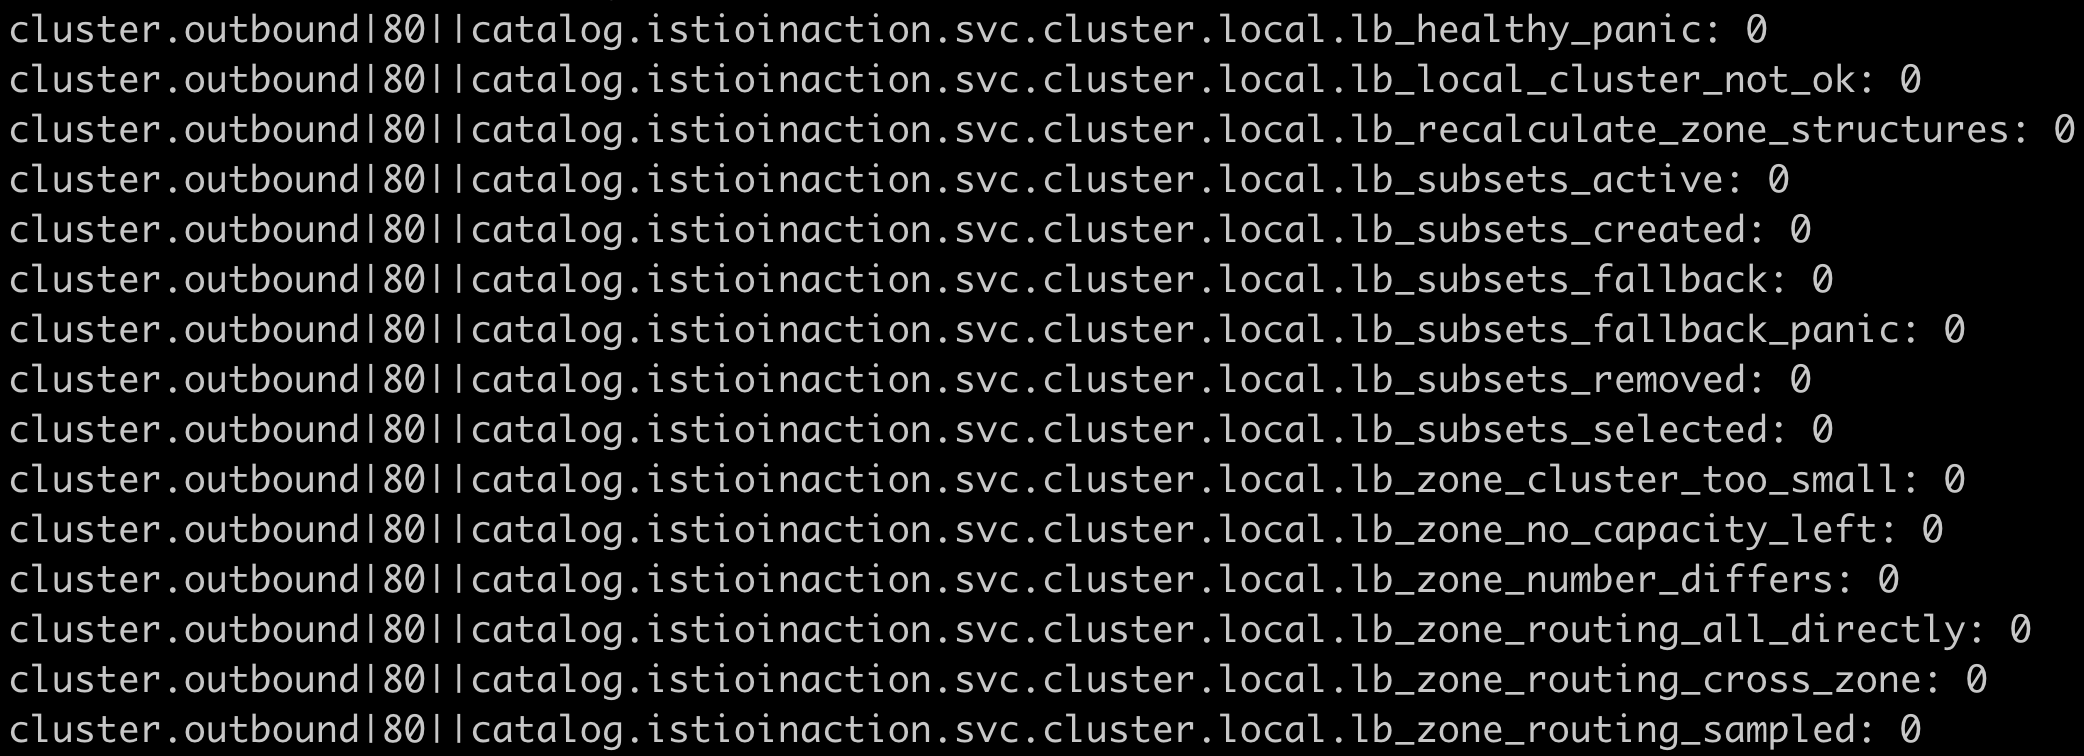
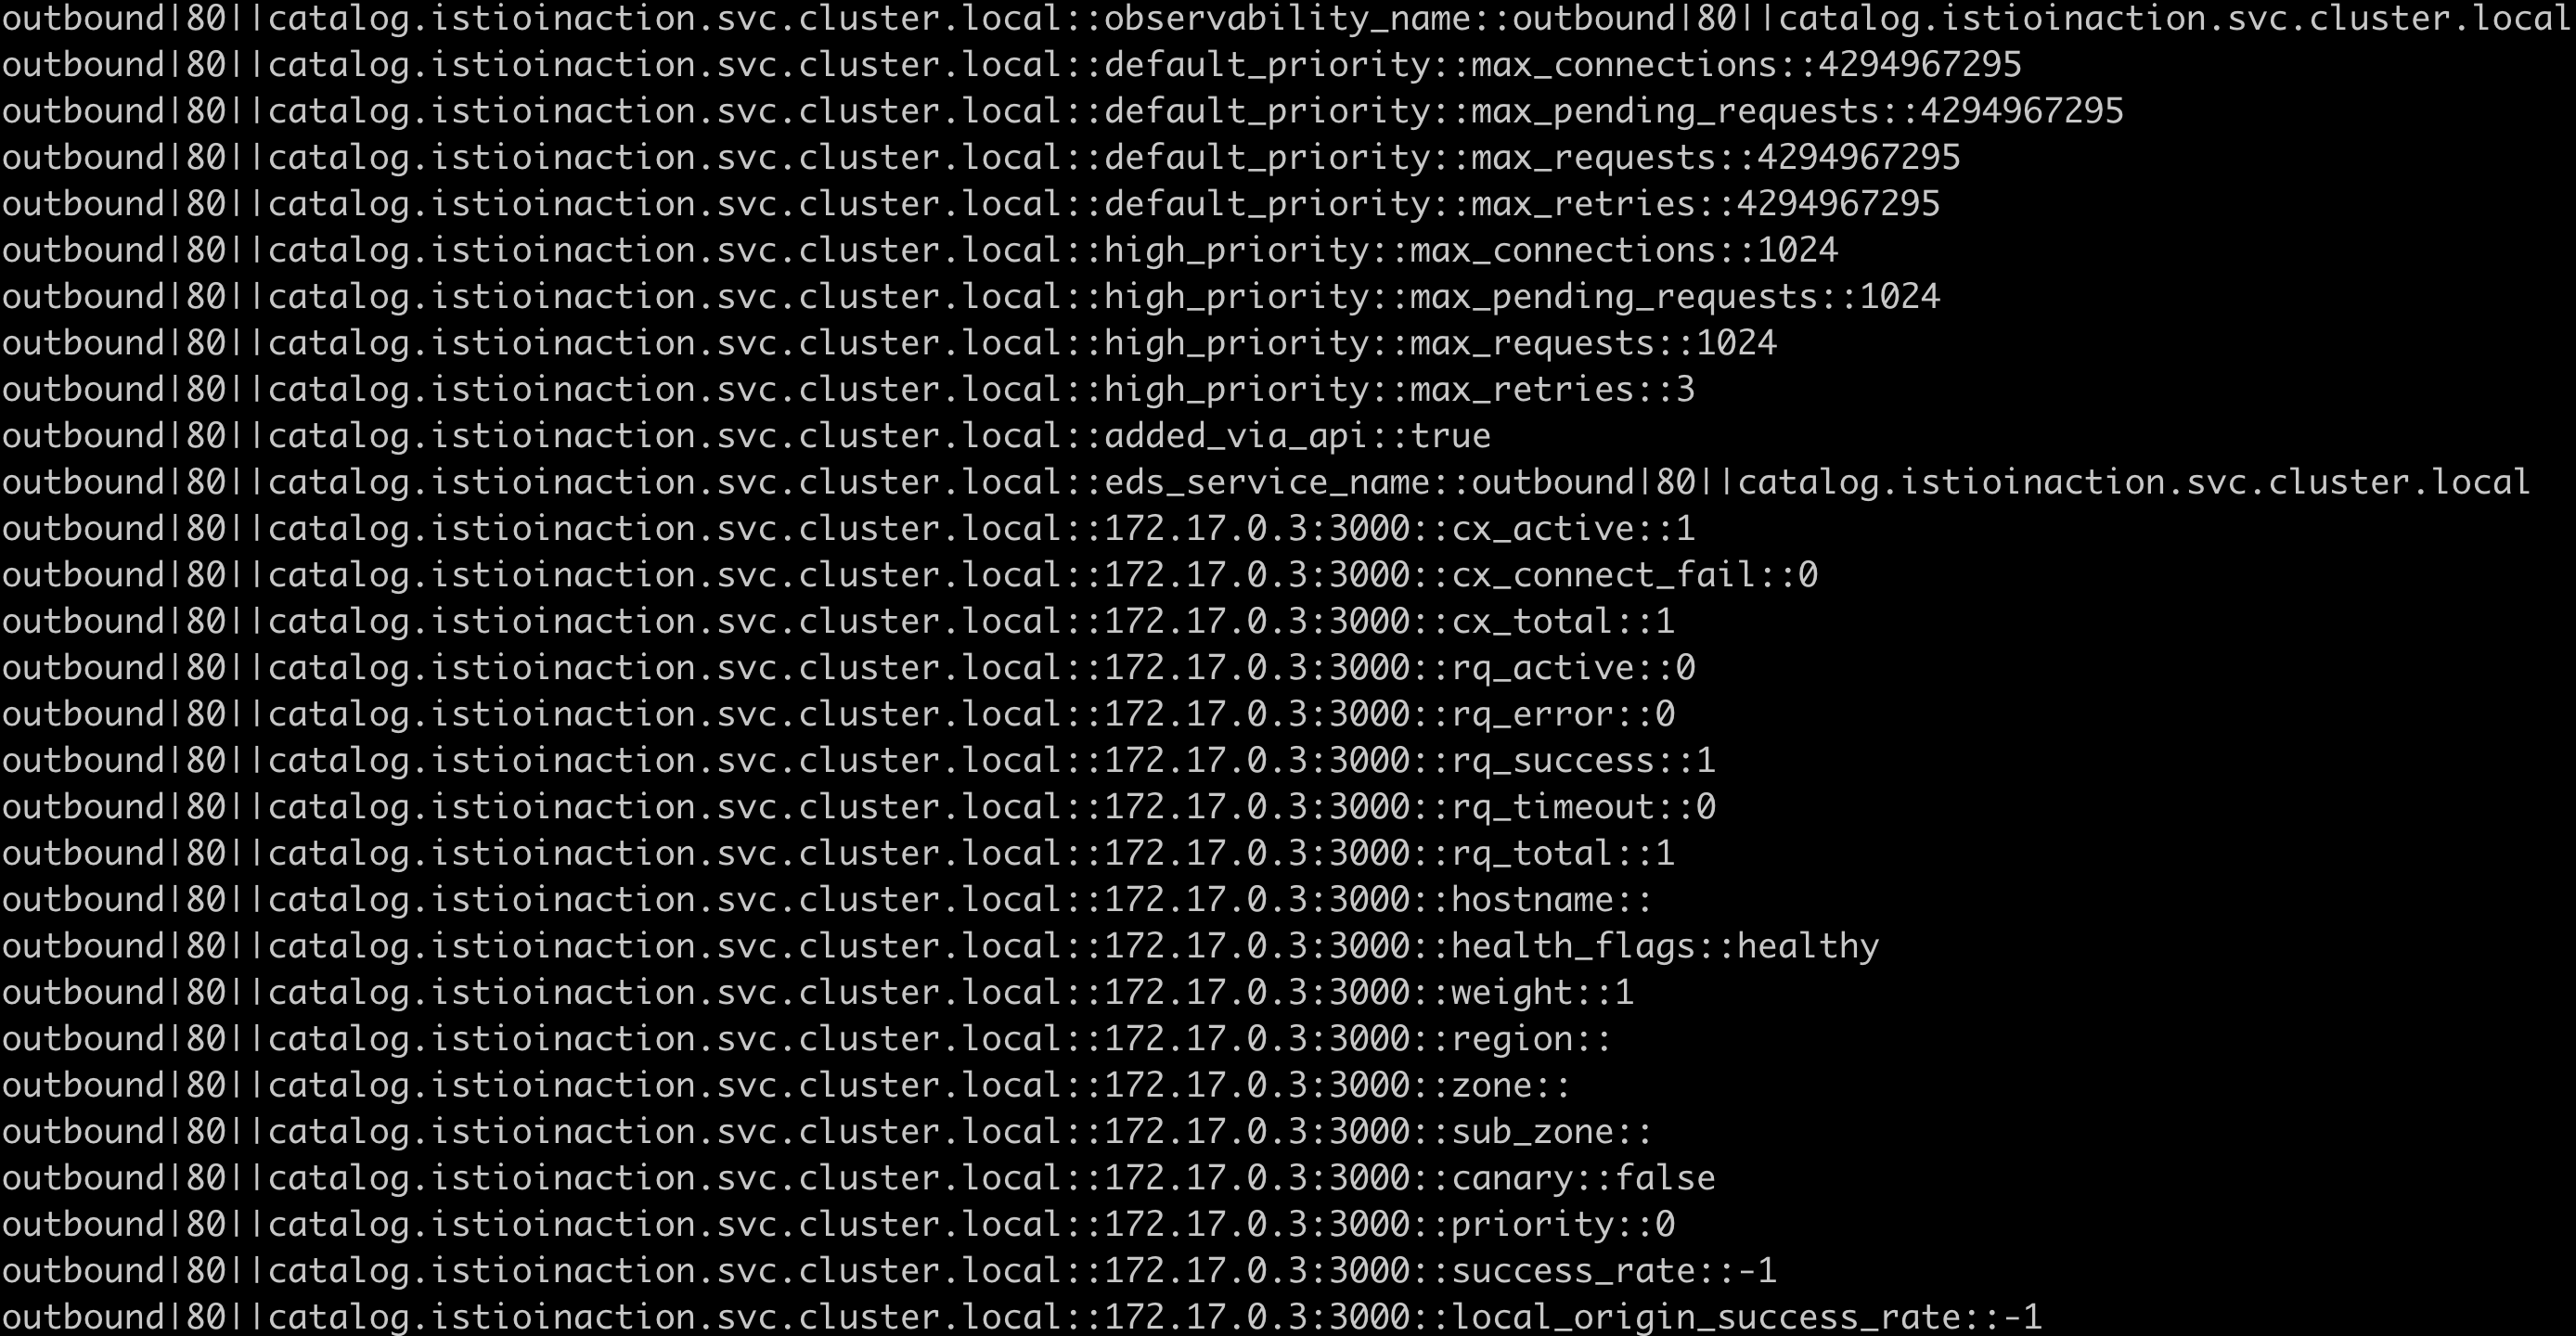
## 이번에는 cluster 별 정보를 조회해 봅니다.
kubectl exec -it deploy/webapp -c istio-proxy \
-- curl localhost:15000/clusters
출력 - catalog endpoint 에 대한 상세한 정보 제공
- IP, region, zone, sub_zone
- cx, rq 정보
7.2.2 Metrics in the control plane
istiod 가 제공하는 풍부한 정보 ~ 예) data-plane proxy별 설정 sync 횟수 , sync 소요시간, bad config 정보, 인증서 발급/교체 등
## 컨트롤플레인 메트릭을 출력합니다
kubectl exec -it -n istio-system deploy/istiod \
-- curl localhost:15014/metrics
출력 확인
## 1. 인증서 관련 정보
citadel_server_csr_count 4
citadel_server_root_cert_expiry_timestamp 1.988253473e+09
citadel_server_success_cert_issuance_count 4
- CSR, Certificate Signing Request 인증서 발급 요청
- Citadel, Istio 보안 컴포넌트
Citadel in Istio is a security component that provides strong service-to-service and end-user authentication with built-in identity and access management functionality. It allows for the configuration of mutual Transport Layer Security (TLS) and service-to-service authentication using JSON Web Tokens (JWT) and X.509 certificates. Citadel also provides support for authenticating end-users using OpenID Connect (OIDC) and OAuth 2.0. It can be used to secure communication within the mesh, as well as between the mesh and external services.
## 2. istio 버전정보
istio_build{component="pilot",tag="1.16.1"} 1
## 3. 설정이 모든 data-plane proxy 에 적용되는데 걸리는 시간 (histogram)
pilot_proxy_convergence_time_bucket{le="0.1"} 1101 # ❶
pilot_proxy_convergence_time_bucket{le="0.5"} 1102 # ❷
pilot_proxy_convergence_time_bucket{le="1"} 1102
pilot_proxy_convergence_time_bucket{le="3"} 1102
pilot_proxy_convergence_time_bucket{le="5"} 1102
pilot_proxy_convergence_time_bucket{le="10"} 1102
pilot_proxy_convergence_time_bucket{le="20"} 1102
pilot_proxy_convergence_time_bucket{le="30"} 1102
pilot_proxy_convergence_time_bucket{le="+Inf"} 1102
pilot_proxy_convergence_time_sum 11.86299839999995
pilot_proxy_convergence_time_count 1102
❶ 1101개 업데이트하는 데 0.1초 이내 (le = less then)
❷ 1101 -> 1102, 1개 업데이트 하는데 0.1~0.5초 소요
## 4. 컨트롤플레인에서 알고있는 서비스개수, 유저가 설정한 VirtualService 개수, xDS로 통신하는 proxy 개수 (gauge)
pilot_services 10
pilot_virt_services 1
pilot_vservice_dup_domain 0
pilot_xds{version="1.16.1"} 4
In Prometheus, a gauge and a counter are both types of metrics, but they have different use cases and behave differently when being queried.
A
gaugeis a metric that represents a value that can go up and down, like the current temperature or the number of active connections. It is used to track the current state of something. A gauge metric can be used to track the current value of a metric, and that value can be increased or decreased over time.A
counter, on the other hand, is a metric that only increases over time, like the number of requests received or the number of errors. It is used to track the rate of change of a metric. A counter metric can be used to track the rate at which a metric is changing over time, and it can only be incremented.When a query is performed on a gauge, it returns the current value of the metric. When a query is performed on a counter, it returns the rate of change of the metric over a certain period of time.
In summary, A
gaugemeasures an instantaneous value, whilecountermeasures the rate of change of a value over a period of time.
## 5. xDS별 업데이트 횟수 (counter)
pilot_xds_pushes{type="cds"} 8
pilot_xds_pushes{type="eds"} 20
pilot_xds_pushes{type="lds"} 8
pilot_xds_pushes{type="rds"} 6
(참고)
- cds - cluster discovery
- eds - endpoints discovery
- lds - listener discovery
- rds - router discovery
- sds - secret discovery
11장에서 control-plane의 성능튜닝을 다룰 때 보다 자세히 control-plane의 메트릭들을 살펴보겠습니다.
지금까지 Observability 를 위한 메트릭들을 data-plain 과 control-plain 으로 나누어 살펴보았습니다.
이처럼 서비스메시에서 제공하는 메트릭을 조회하고 오퍼레이터 등에서 활용하기 위해서는 메트릭을 수집하고 저장 하여야 합니다.
이러한 방법들에 대하여 이어서 살펴보겠습니다
7.3 Scraping Istio metrics with prometheus
## 앞서 살펴본 /stats 을 프로메테우스 형식으로 출력합니다
kubectl exec -it deploy/webapp -c istio-proxy \
-- curl localhost:15090/stats/prometheus
출력
#...
envoy_cluster_upstream_cx_overflow{cluster_name="outbound|80||catalog.."} 0
envoy_cluster_upstream_rq_pending_overflow{cluster_name="outbound|80||catalog.."} 0
envoy_cluster_upstream_rq_retry_overflow{cluster_name="outbound|80||catalog.."} 0
#...
참고) /stats 와 /stats/prometheus 의 차이점
/stats 는 istio-proxy 가 수집한 통계정보 출력. 디버깅/모니터링 용도. /reset_counters 로 초기화
/stats/prometheus 는 istio-proxy 가 수집한 통계정보를 prometheus에 제공하기 위한 exporter endpoint. /reset_counters 로 초기화 할 수 없음
지금부터 Prometheus 가 수집하도록 구성해 보겠습니다
7.3.1 Setting up Prometheus and Grafana
kube-prometheus-stack 설치
helm repo add prometheus-community https://prometheus-community.github.io/helm-charts

helm repo update
kubectl create ns prometheus

helm install prom prometheus-community/kube-prometheus-stack \
--version 13.13.1 -n prometheus -f ch7/prom-values.yaml
(참고) 13.13.1 (k8s 1.25.1)
(방법1) prom-kube-prometheus-stack-admission-patch- Job 실행에러 발생 ⇒ disable
# vi ch7/prom-values.yaml
#...
admissionWebhooks:
  #...
  patch:
    enabled: false
#...
- admissionWebhook 은 promQL 등 crd 명세 제출시 validation 을 수행함
(방법2) kube-webhook-certgen 교체 (권장) (참고) https://github.com/kubernetes/ingress-nginx/issues/7418
# vi ch7/prom-values.yaml
#...
admissionWebhooks:
  #...
  patch:
    enabled: true
    image:
      repository: rpkatz/kube-webhook-certgen
      tag: v1.5.2
#...
(참고) prometheus 삭제
helm uninstall prom

kubectl get all -n prometheus

kubectl delete job --all -n prometheus

kubectl delete ns prometheus
7.3.2 Configuring the Prometheus Operator to scrape the Istio control plane and workloads
Prometheus 에서 Istio 메트릭을 수집하려면 ServiceMonitor / PodMonitor (CRD) 명세 작성이 필요합니다.
아래 ServiceMonitor 명세는 control-plane 의 istio operator (istiod) 메트릭을 수집합니다.
- targetLabels 에서
app레이블을 가진 서비스들 중에서 istio=pilot레이블을 포함하는 서비스를 대상으로 메트릭을 수집합니다
# cat ch7/service-monitor-cp.yaml
---
apiVersion: monitoring.coreos.com/v1
kind: ServiceMonitor
metadata:
  name: istio-component-monitor
  namespace: prometheus
  labels:
    monitoring: istio-components
    release: prom
spec:
  jobLabel: istio
  targetLabels: [app]
  selector:
    matchExpressions:
    - {key: istio, operator: In, values: [pilot]}
  namespaceSelector:
    any: true
  endpoints:
  - port: http-monitoring
    interval: 15s
- ServiceMonitorSpec
-
jobLabelselects the label from the associated Kubernetes Service which will be used as thejoblabel for all metrics. If the value of this field is empty or if the label doesn’t exist for the given Service, thejoblabel of the metrics defaults to the name of the Kubernetes Service.(예시) If in
ServiceMonitor.spec.jobLabel: fooand inService.metadata.labels.foo: bar, then thejob="bar"label is added to all metrics.
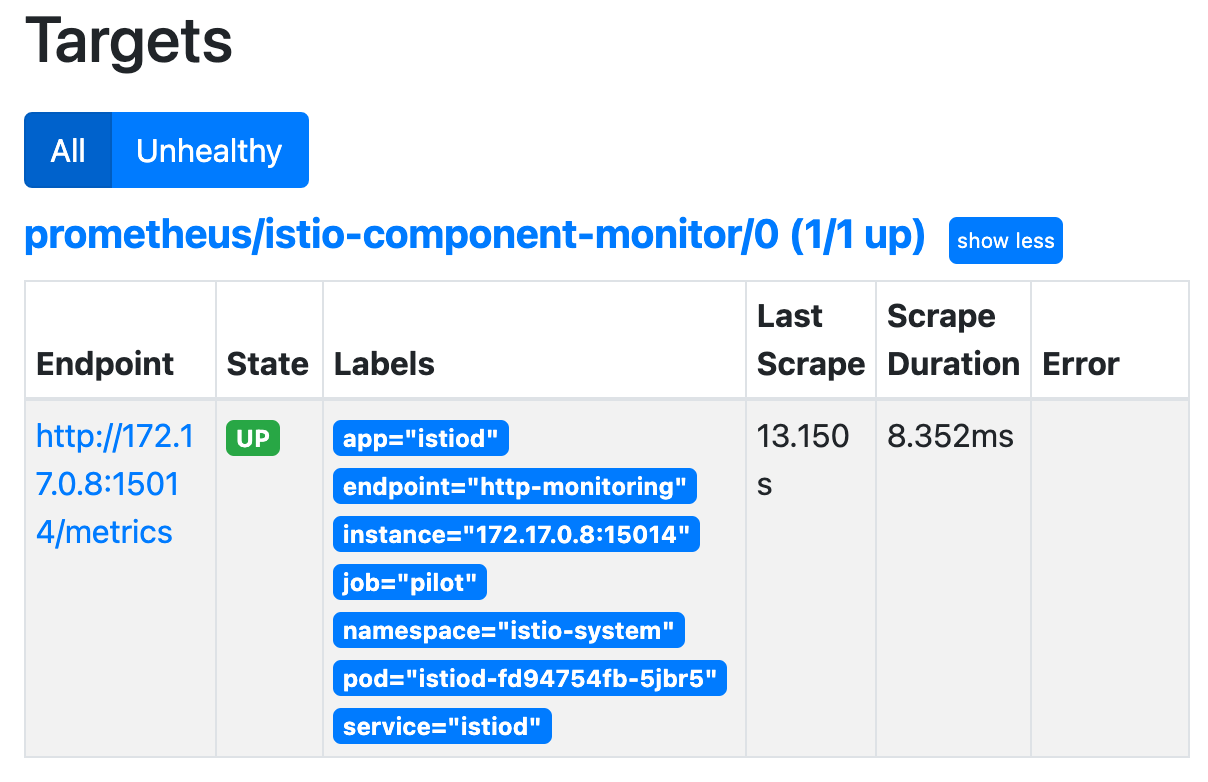
(참고) istiod의 Service Spec
ServiceMonitor 에서 jobLabel=istio 이고, Service 에서 istio=pilot 이므로, 메트릭에는 job="pilot" 이 추가됨
# kubectl describe svc istiod -n istio-system

#...
Labels:            app=istiod
#...
                   istio=pilot
#...
Port:              http-monitoring  15014/TCP
TargetPort:        15014/TCP
Endpoints:         172.17.0.8:15014
#...
ServiceMonitor 적용
## 적용
kubectl apply -f ch7/service-monitor-cp.yaml -n prometheus
## 확인
kubectl get servicemonitor -n prometheus

NAME                       AGE
istio-component-monitor    67s
#...
로컬에서 prometheus 대시보드에 접근 가능하도록 port-forward
kubectl -n prometheus port-forward \
statefulset/prometheus-prom-kube-prometheus-stack-prometheus 9090
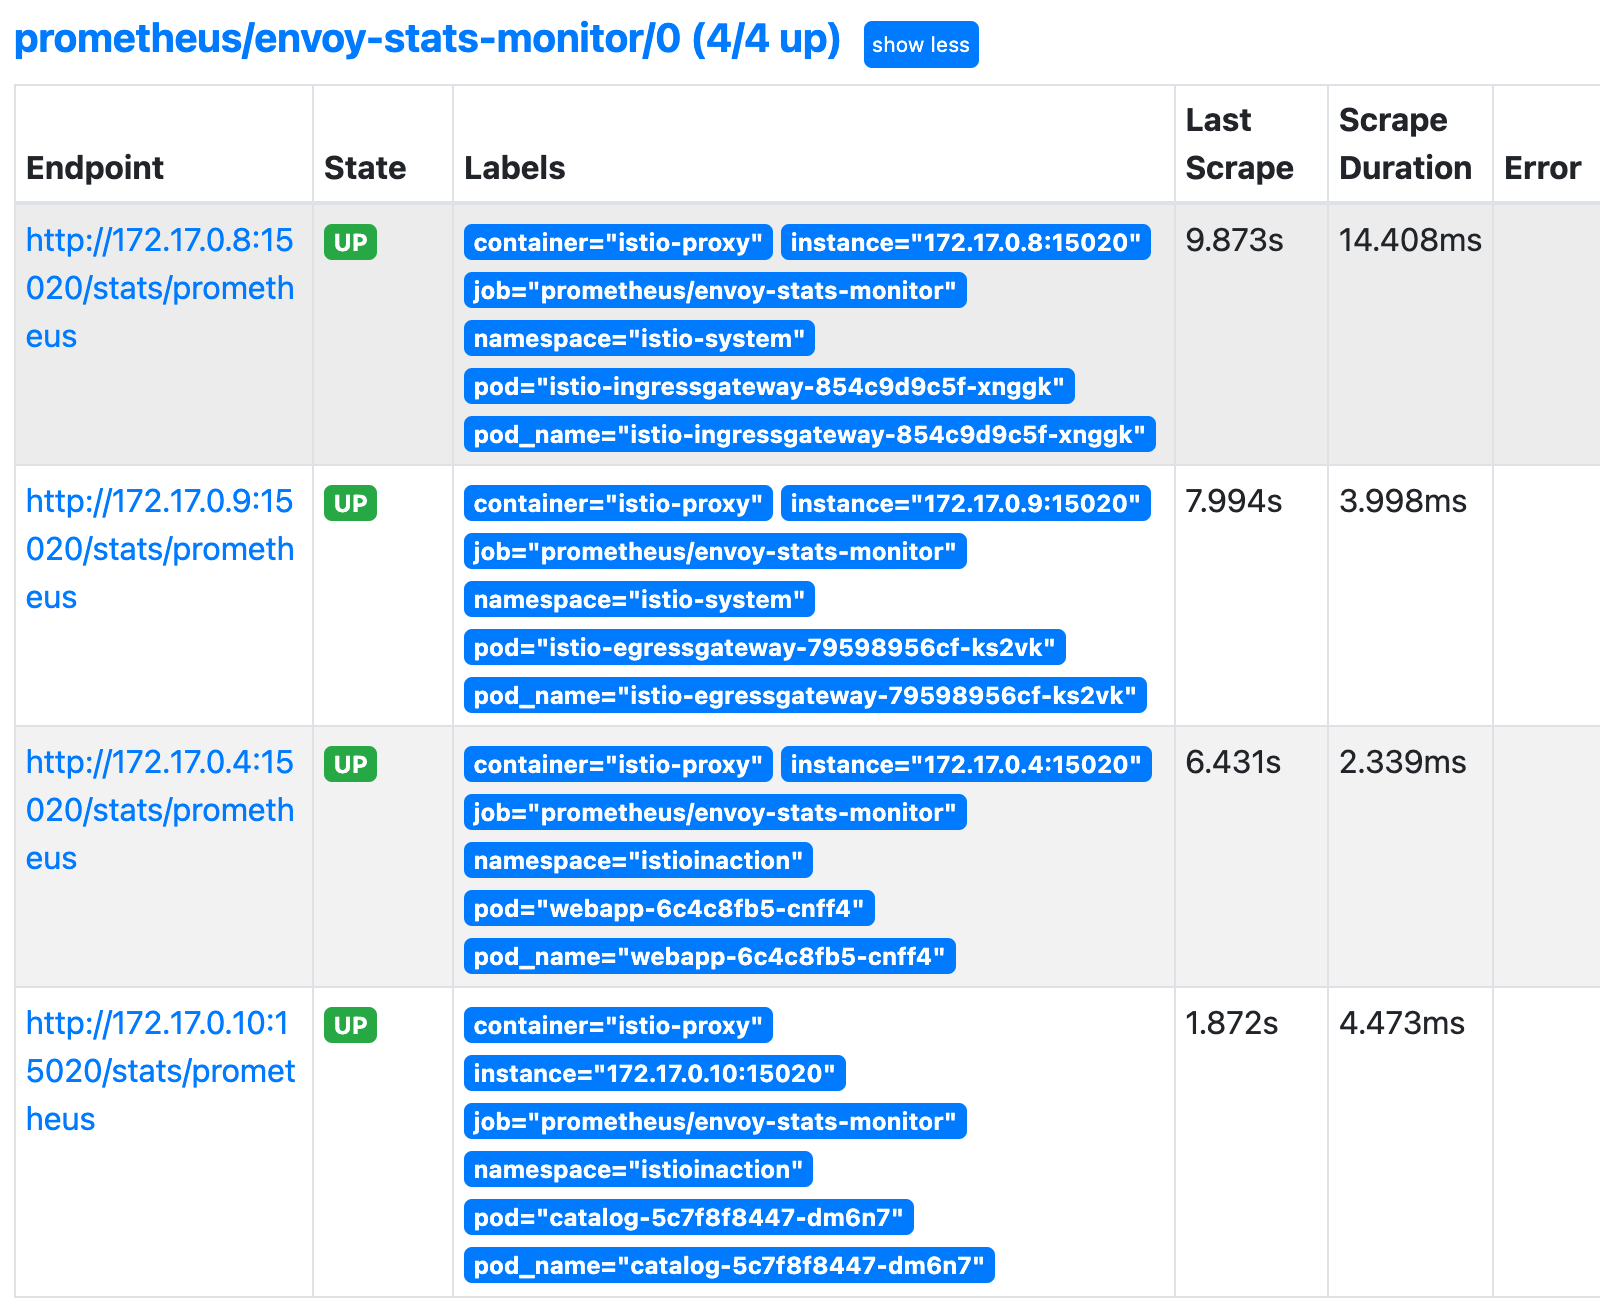
이번에는 data-plane 메트릭 수집을 위해 PodMonitor를 적용해 봅니다.
Pod Sidecar로 떠있는 istio-proxy 컨테이너의 메트릭을 수집하는 PodMonitor 명세입니다
# cat ch7/pod-monitor-dp.yaml
---
apiVersion: monitoring.coreos.com/v1
kind: PodMonitor
metadata:
  name: envoy-stats-monitor
  namespace: prometheus
  labels:
    monitoring: istio-proxies
    release: prom
spec:
  selector:
    matchExpressions:
    - {key: istio-prometheus-ignore, operator: DoesNotExist}
  namespaceSelector:
    any: true
  jobLabel: envoy-stats
  podMetricsEndpoints:
  - path: /stats/prometheus
    interval: 15s
    relabelings:
    - action: keep
      sourceLabels: [__meta_kubernetes_pod_container_name]
      regex: "istio-proxy"
    - action: keep
      sourceLabels: [__meta_kubernetes_pod_annotationpresent_prometheus_io_scrape]
    - sourceLabels: [__address__, __meta_kubernetes_pod_annotation_prometheus_io_port]
      action: replace
      regex: ([^:]+)(?::\d+)?;(\d+)
      replacement: $1:$2
      targetLabel: __address__
    - action: labeldrop
      regex: "__meta_kubernetes_pod_label_(.+)"
    - sourceLabels: [__meta_kubernetes_namespace]
      action: replace
      targetLabel: namespace
    - sourceLabels: [__meta_kubernetes_pod_name]
      action: replace
      targetLabel: pod_name
## PodMonitor 설정 적용
kubectl apply -f ch7/pod-monitor-dp.yaml -n prometheus
Targets 에서 PodMonitor 적용 확인
## metric 확인을 위해서 호출테스트를 수행합니다
for i in {1..100}; do curl http://localhost/api/catalog \
-H "Host: webapp.istioinaction.io"; sleep .5; done
Graph 메뉴에서 수집된 메트릭을 확인해보세요
7.4 Customizing Istio’s standard metrics
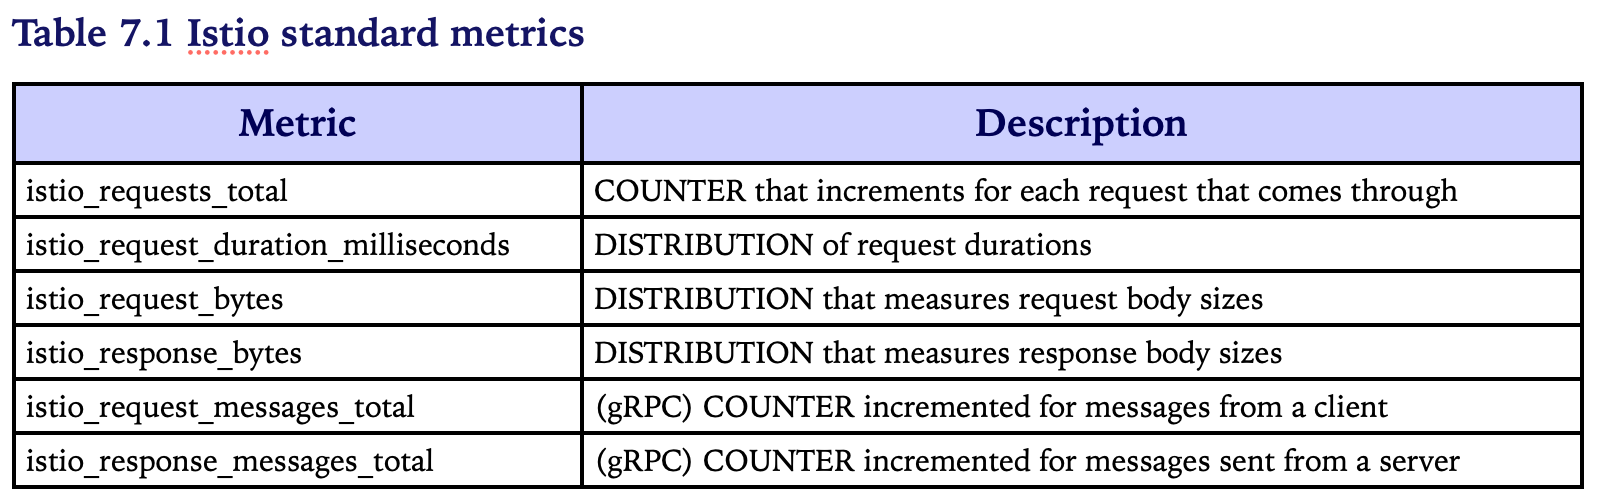
Istio Standard Metrics
Istio 표준 메트릭은 COUNTER와 DISTRIBUTION로 표현되고 Envoy의 메트릭 counter와 histogram과 연관됩니다.
- A
COUNTERis a strictly increasing integer. - A
DISTRIBUTIONmaps ranges of values to frequency.
Envoy Plugin - 메트릭의 출력, 커스텀, 생성을 제어합니다
Main Concept
- Metric : counter, gauge, histogram/distribution (between service calls)
-
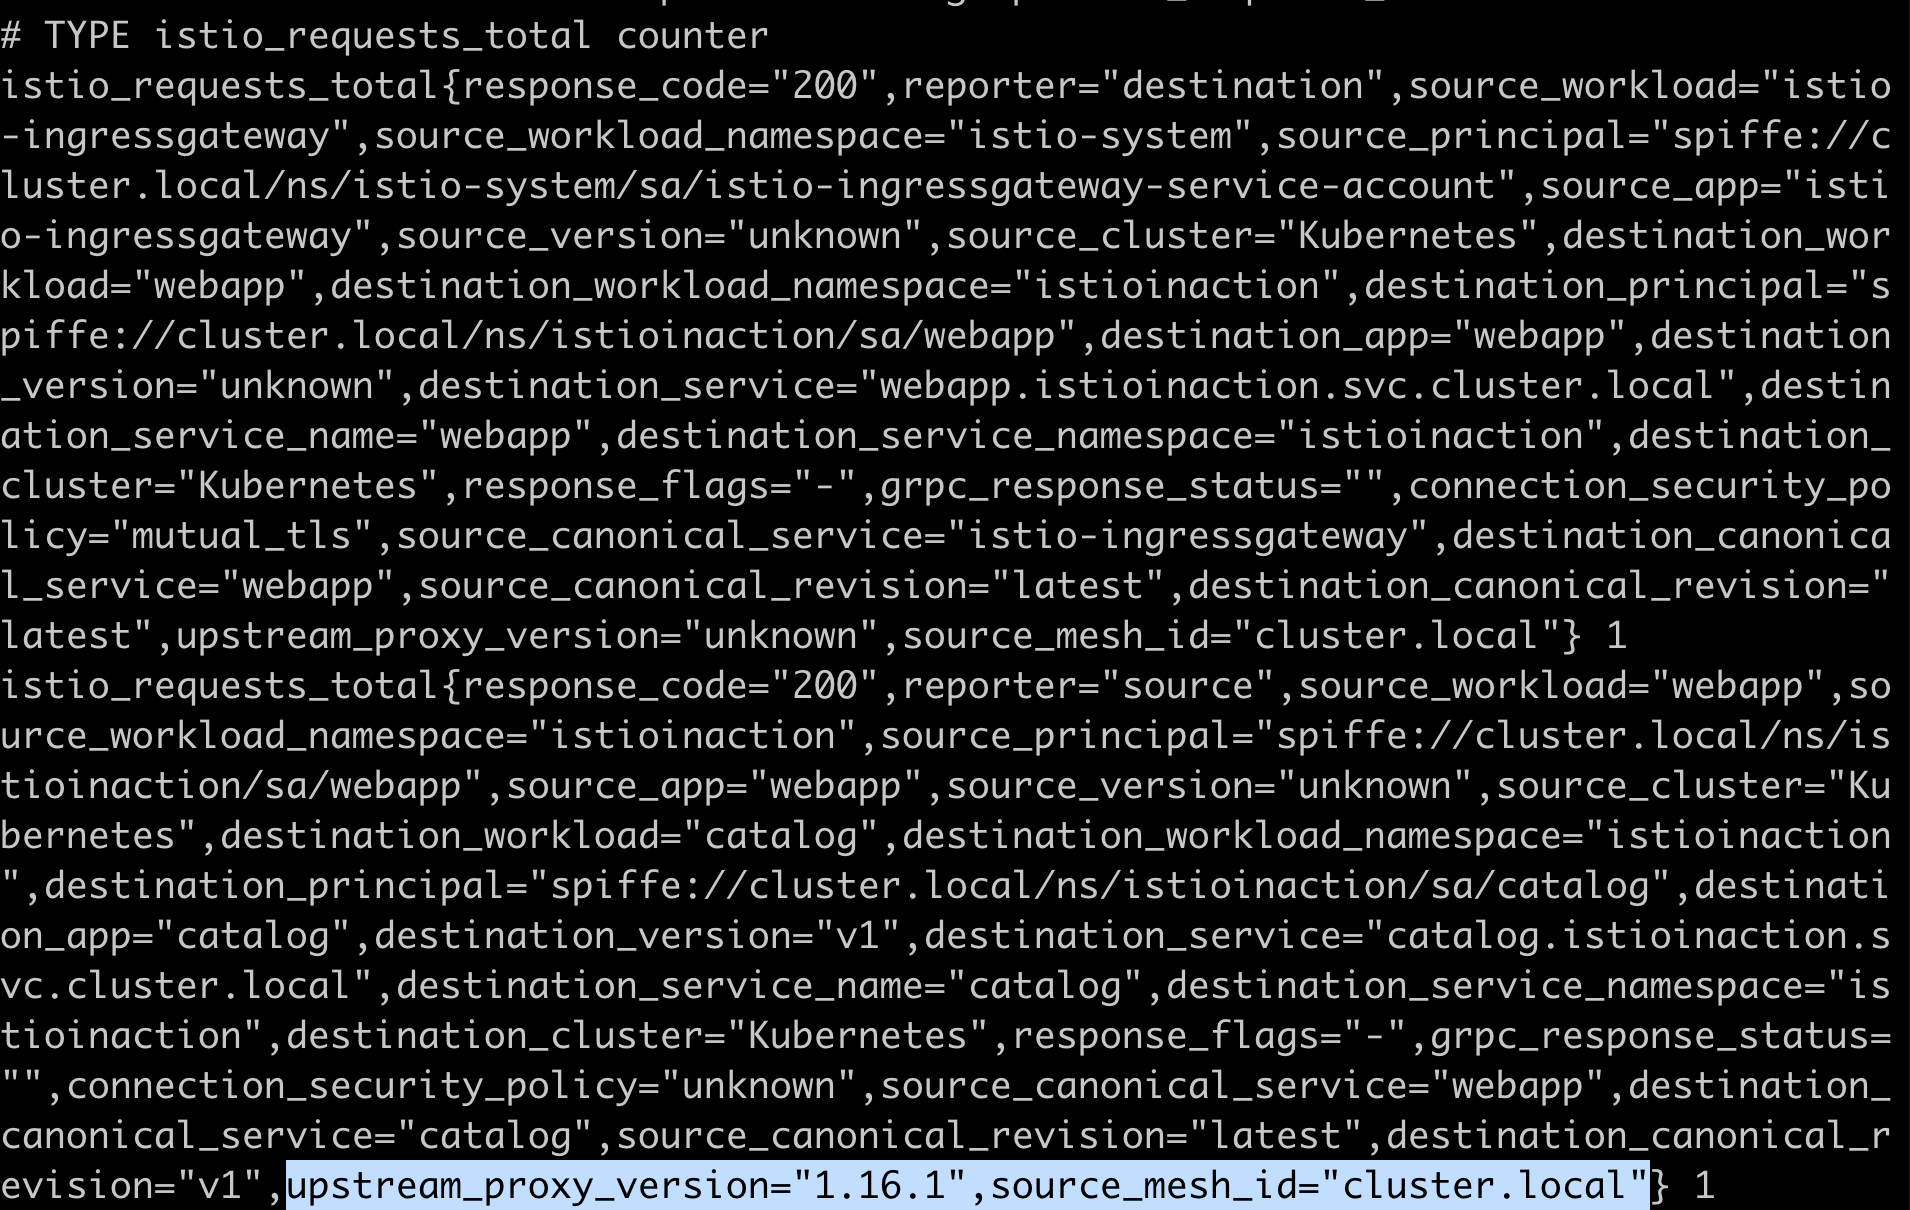
Dimension :
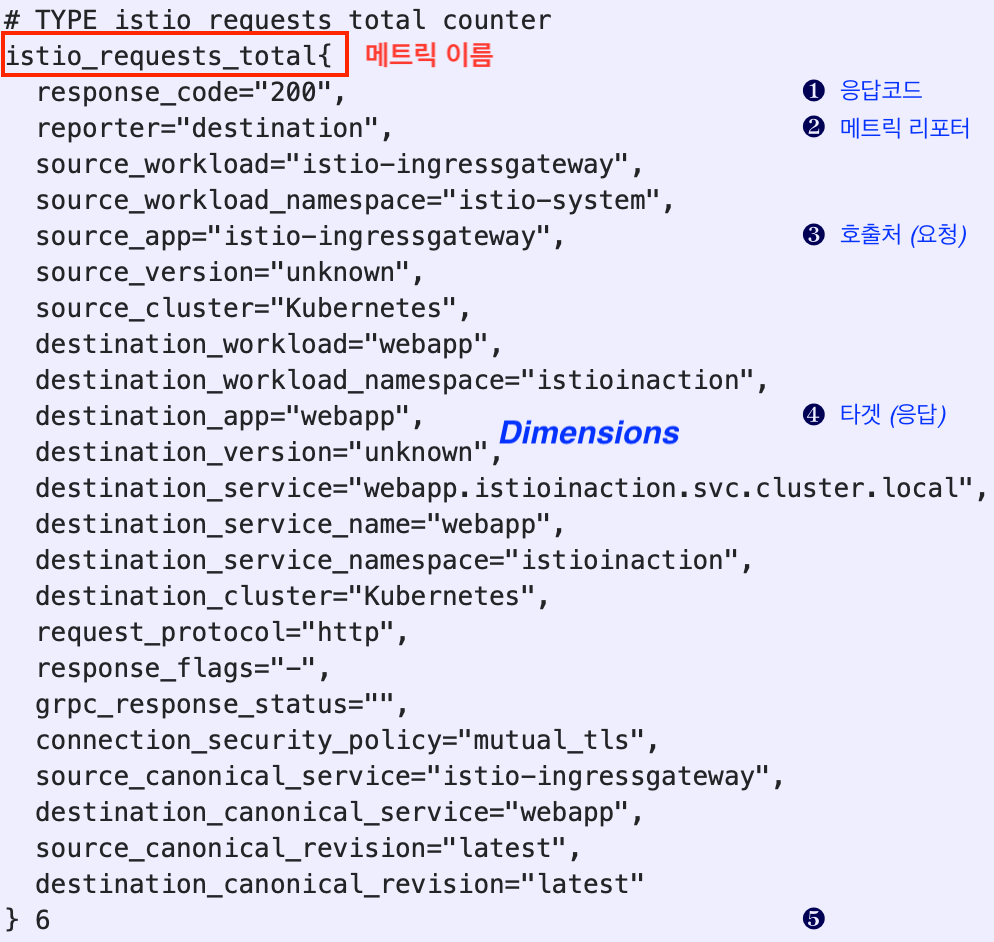
아래 istio_requests_total 메트릭들은 서로 다른 dimensions 을 가지고 있습니다.
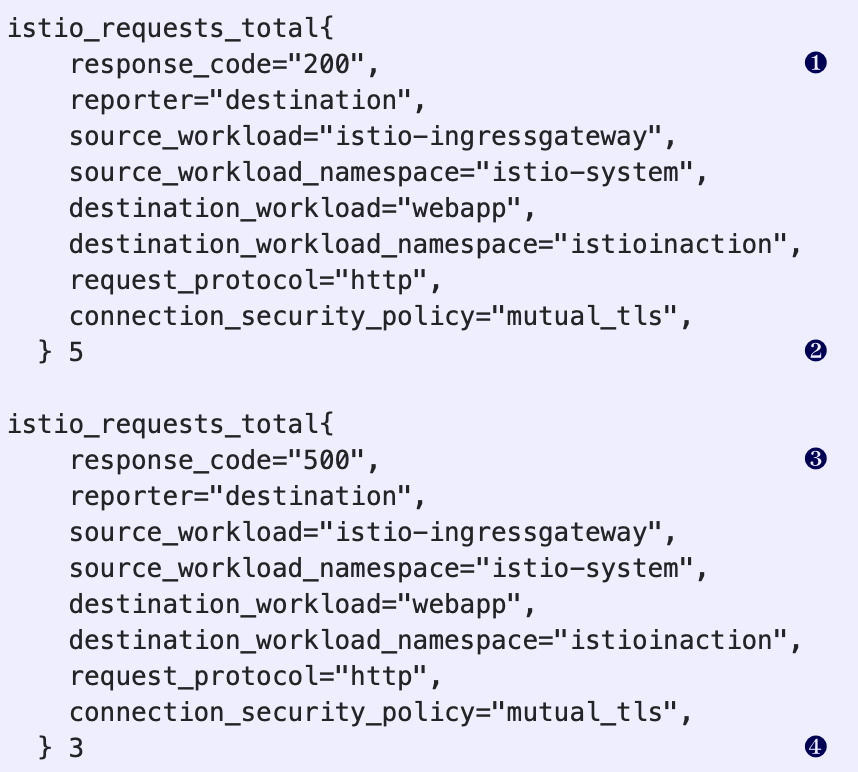
이러한 dimension value 들은 어디서 올까요 ? from attributes
-
Envoy의 request attributes
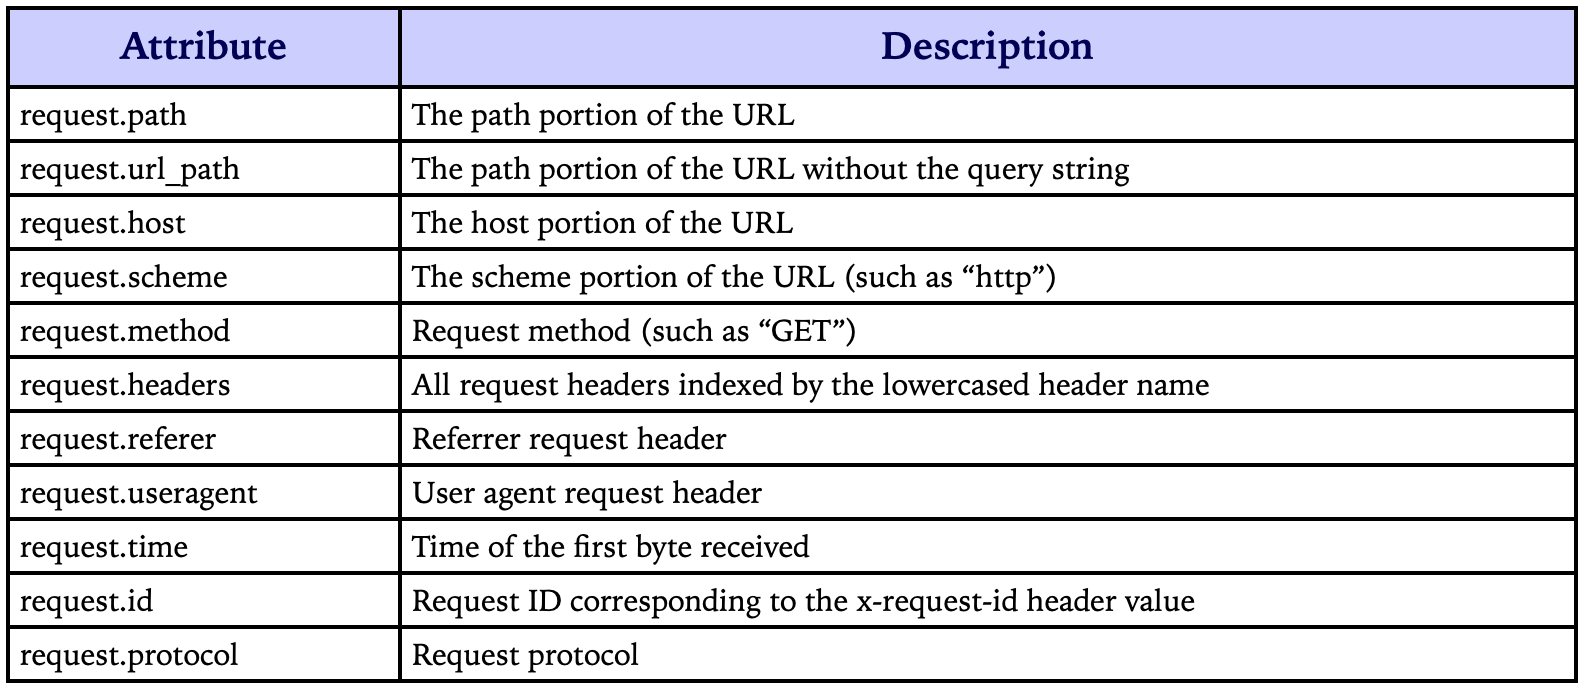
Envoy Attributes 종류
- Request
- Response
- Connection
- Upstream
- Metadata/filter state
- Wasm
Istio의 Attributes (from Istio’s peer-metadata filter built into Istio-proxy)
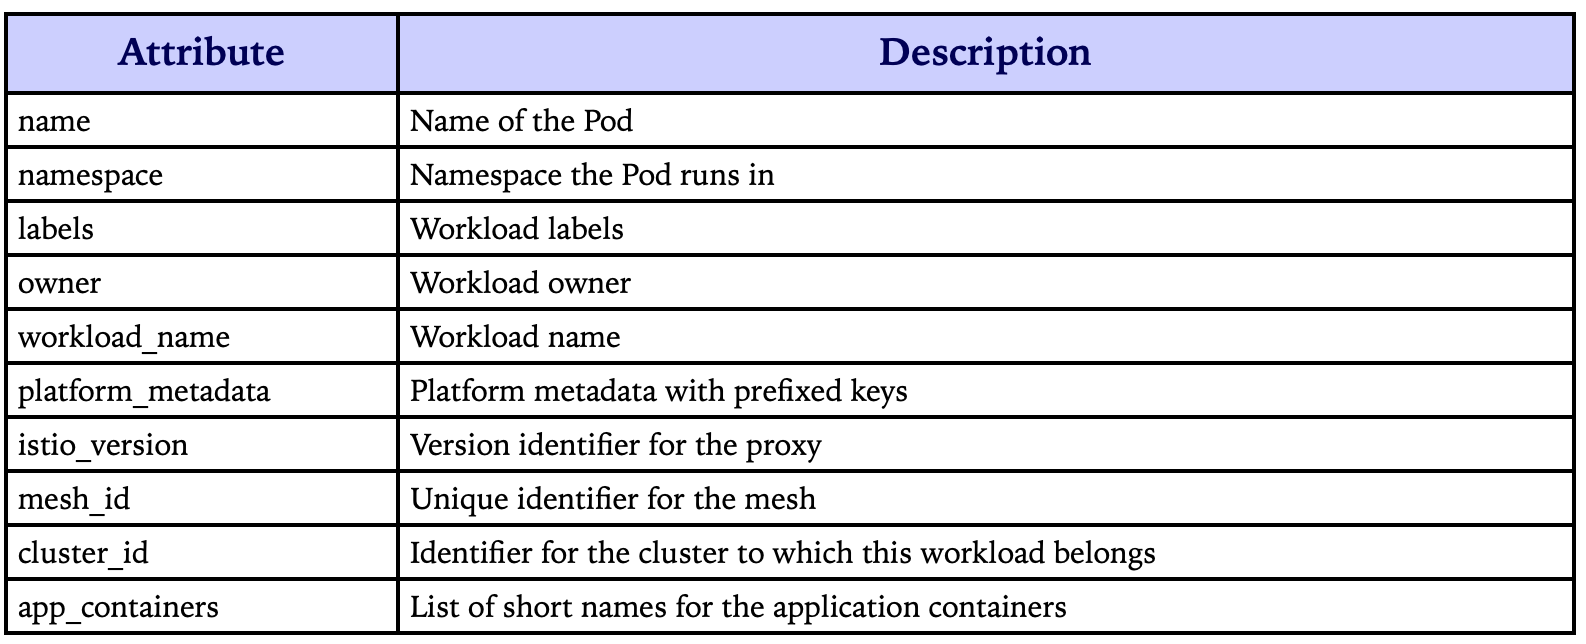
- prefix them with upstream_peer or downstream_peer
- 예) downstream_peer.istio_version, upstream_peer.cluster_id
살펴본 바와 같이 Attribute 는 Dimension value 를 정의하는데 사용됩니다.
Attribute 를 사용해서 기존 metric의 Dimension 을 커스터마이징 해봅시다.
7.4.1 Configuring existing metrics
Istio 의 기본 메트릭 설정은 EnvoyFilter 의 stats proxy plugin 에 설정됩니다.
Istio 가 설치될 때 함께 설치되는 EnvoyFilter 는 다음과 같습니다. (istio 1.16.1)
# kubectl get envoyfilter -n istio-system

NAME                    AGE
stats-filter-1.13       17d
stats-filter-1.14       17d
stats-filter-1.15       17d
stats-filter-1.16       17d
tcp-stats-filter-1.13   17d
tcp-stats-filter-1.14   17d
tcp-stats-filter-1.15   17d
tcp-stats-filter-1.16   17d
# kubectl get envoyfilter stats-filter-1.16 -n istio-system
#...
  - applyTo: HTTP_FILTER
    match:
      context: SIDECAR_OUTBOUND
      listener:
        filterChain:
          filter:
            name: envoy.filters.network.http_connection_manager
            subFilter:
              name: envoy.filters.http.router
      proxy:
        proxyVersion: ^1\.16.*
    patch:
      operation: INSERT_BEFORE
      value:
        name: istio.stats     # ❶
        typed_config:
          '@type': type.googleapis.com/udpa.type.v1.TypedStruct
          type_url: type.googleapis.com/envoy.extensions.filters.http.wasm.v3.Wasm
          value:
            config:           # ❷
              configuration:
                '@type': type.googleapis.com/google.protobuf.StringValue
                value: |
                  {
                    "debug": "false",
                    "stat_prefix": "istio"
                  }
              root_id: stats_outbound
              vm_config:
                code:
                  local:
                    inline_string: envoy.wasm.stats
                runtime: envoy.wasm.runtime.null
                vm_id: stats_outbound
#...
❶ istio.stats : Wasm (WebAssembly) plugin that implements the statistics functionality. This Wasm filter is actually compiled directly into the Envoy codebase and runs against a NULL VM, so it’s not run in a Wasm VM.
istio.stats 는 Wasm filter 임. 이 filter는 Envoy 코드에 컴파일돼 있고, NULL VM 에서 동작함 (Not in a Wasm VM)
To run it in a Wasm VM, you must pass the –setvalues.telemetry.v2.prometheus.wasmEnabled=true flag to installation with istioctl or the respective IstioOperator configuration.
(실습) 기존 메트릭에 “DIMENSION”을 추가해 보아요
“Let’s add upstream_proxy_version and source_mesh_id dimensions”
기존
# kubectl get istiooperator installed-state -n istio-system -o yaml | grep -E "prometheus:|telemetry:" -A2
    telemetry:
      enabled: true
      v2:
--
        prometheus:
          enabled: true
          wasmEnabled: false
dimension 을 “추가❶”하거나 “삭제❷”할 수 있습니다
# cat ch7/metrics/istio-operator-new-dimensions.yaml
---
apiVersion: install.istio.io/v1alpha1
kind: IstioOperator
spec:
  profile: demo
  values:
    telemetry:
      v2:
        prometheus:
          configOverride:
            inboundSidecar:
              metrics:
              - name: requests_total
                dimensions:     # ❶
                  upstream_proxy_version: upstream_peer.istio_version
                  source_mesh_id: node.metadata['MESH_ID']
                tags_to_remove: # ❷
                - request_protocol
            outboundSidecar:
              metrics:
              - name: requests_total
                dimensions:
                  upstream_proxy_version: upstream_peer.istio_version
                  source_mesh_id: node.metadata['MESH_ID']
                tags_to_remove:
                - request_protocol
            gateway:
              metrics:
              - name: requests_total
                dimensions:
                  upstream_proxy_version: upstream_peer.istio_version
                  source_mesh_id: node.metadata['MESH_ID']
                tags_to_remove:
                - request_protocol
dimesion을 변경할 metric: requests_total
주) metrix prefix istio_ 는 자동으로 붙기 때문에생략해야 됨
- dimensions:
- upstream_proxy_version
- a value from an attribute “upstream_peer.istio_version”
- source_mesh_id
- a value from an attribute “node.metadata[’MESH_ID’]
- upstream_proxy_version
istioctl install -f ch7/metrics/istio-operator-new-dimensions.yaml -y

✔ Istio core installed
✔ Istiod installed
✔ Egress gateways installed
✔ Ingress gateways installed
✔ Installation complete
- 참고:
--dry-run옵션을 추가하면 미리 적용결과를 진단해 볼 수 있습니다-
verify-install커맨드를 사용하면 리소스별로 적용결과를 출력합니다istioctl verify-install -f ch7/metrics/istio-operator-new-dimensions.yaml ✔ ClusterRole: istiod-istio-system.istio-system checked successfully ✔ ClusterRole: istio-reader-istio-system.istio-system checked successfully ✔ ClusterRoleBinding: istio-reader-istio-system.istio-system checked successfully ✔ ClusterRoleBinding: istiod-istio-system.istio-system checked successfully ✔ ServiceAccount: istio-reader-service-account.istio-system checked successfully #...
## istiooperator 명세가 업데이트 되고
kubectl get istiooperator installed-state \
 -n istio-system -o yaml | grep -E "prometheus:" -A9

        prometheus:
          configOverride:
            gateway:
              metrics:
              - dimensions:
                  source_mesh_id: node.metadata['MESH_ID']
                  upstream_proxy_version: upstream_peer.istio_version
                name: requests_total
                tags_to_remove:
                - request_protocol

## envoyfilter "stats-filter-{stat-postfix}"도 업데이트 되었습니다
kubectl get envoyfilter stats-filter-1.16 \
 -n istio-system -o yaml

#...
value: |
  {"metrics":[{"dimensions":{"source_mesh_id":"node.metadata['MESH_ID']","upstream_proxy_version":"upstream_peer.istio_version"},"name":"requests_total","tags_to_remove":["request_protocol"]}]}
#...
“Let’s Istio’s proxy know about it (New dimension)”
⇒ annotate “Pod spec” sidecar.istio.io/extraStatTags
istio 1.17+ 부터 custom dimension 에 대한 annotation (extraStatTags) 설정이 필요없어졌습니다.
참고) https://istio.io/latest/news/releases/1.17.x/announcing-1.17/change-notes/
# cat ch7/metrics/webapp-deployment-extrastats.yaml
#...
spec:
  replicas: 1
  selector:
    matchLabels:
      app: webapp
  template:
    metadata:
      annotations:
        proxy.istio.io/config: |-
          extraStatTags:
          - "upstream_proxy_version"
          - "source_mesh_id"
      labels:
        app: webapp
#...
# 적용
kubectl apply -n istioinaction -f\
 ch7/metrics/webapp-deployment-extrastats.yaml
# 호출
curl -H "Host: webapp.istioinaction.io" \
http://localhost/api/catalog

[{"id":1,"color":"amber","department":"Eyewear","name":"Elinor Glasses","price":"282.00"},{"id":2,"color":"cyan","department":"Clothing","name":"Atlas Shirt","price":"127.00"},{"id":3,"color":"teal","department":"Clothing","name":"Small Metal Shoes","price":"232.00"},{"id":4,"color":"red","department":"Watches","name":"Red Dragon Watch","price":"232.00"}]
# 메트릭 체크
kubectl -n istioinaction exec -it deploy/webapp -c istio-proxy \
-- curl localhost:15000/stats/prometheus | grep istio_requests_total
istio_requests_total (metric) 에 dimension (upstream_proxy_version, source_mesh_id) 추가됨
 tags_to_remove : [request_protocol] 삭제됨
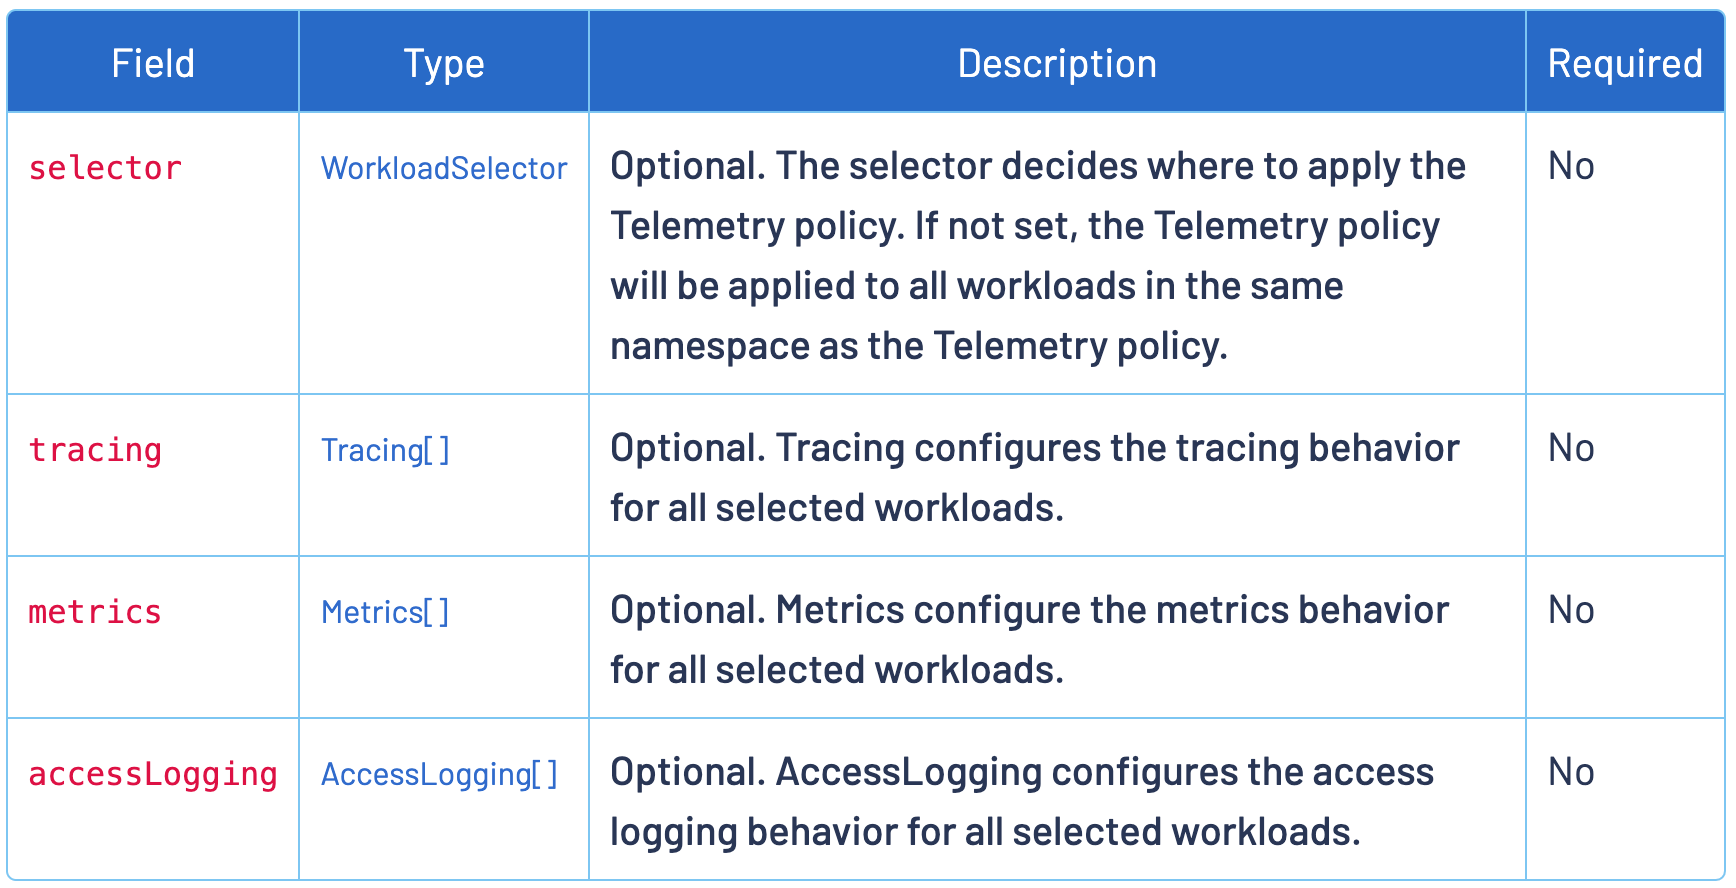
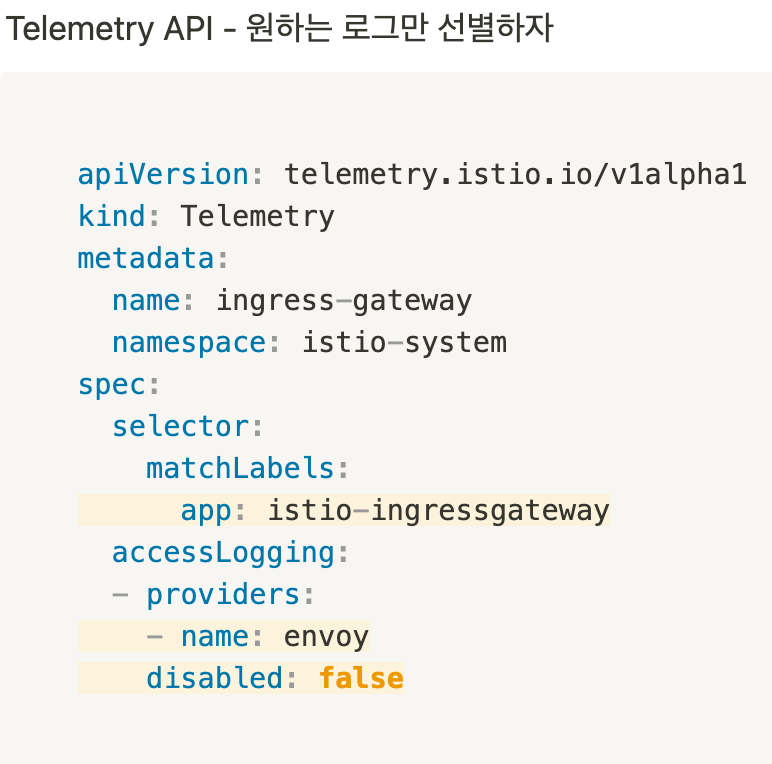
지금까지 실습한 dimension 추가와 삭제는 Telemetry API를 이용해서도 가능합니다.
Telemetry API 로 dimension을 추가해 봅시다 (Istio 1.12+)
앞서 IstioOperator 를 이용한 new metric 설정은 “전역 설정 (globally config.)” 입니다.
Telemetry API를 이용하면 namespace, workload 단위로 설정할 수 있어욧!
먼저 전역설정한 dimension (upstream_proxy_version, source_mesh_id)을 삭제합니다
istioctl install -y -f -<<END
apiVersion: install.istio.io/v1alpha1
kind: IstioOperator
spec:
  profile: demo
  values:
    telemetry:
      v2:
        prometheus:
          configOverride:
            inboundSidecar:
              metrics:
              - name: requests_total
                tags_to_remove:
                - upstream_proxy_version
                - source_mesh_id
            outboundSidecar:
              metrics:
              - name: requests_total
                tags_to_remove:
                - upstream_proxy_version
                - source_mesh_id
            gateway:
              metrics:
              - name: requests_total
                tags_to_remove:
                - upstream_proxy_version
                - source_mesh_id
END
Telemetry 로 istioinaction 네임스페이스에 dimension을 추가/삭제하면 다음과 같습니다.
# cat ch7/metrics/v2/add-dimensions-telemetry.yaml
---
apiVersion: telemetry.istio.io/v1alpha1
kind: Telemetry
metadata:
  name: add-dimension-tags
  namespace: istioinaction
spec:
  metrics:
  - providers:
      - name: prometheus
    overrides:
      - match:
          metric: REQUEST_COUNT
          mode: CLIENT_AND_SERVER
        disabled: false
        tagOverrides:
          upstream_proxy_version:
            operation: UPSERT
            value: upstream_peer.istio_version
          source_mesh_id:
            operation: UPSERT
            value: node.metadata['MESH_ID']
          request_protocol:
            operation: REMOVE
## 적용
kubectl apply -n istioinaction -f \
ch7/metrics/v2/add-dimensions-telemetry.yaml
Telemetry
-
Istio 공식 Telemetry 문서
-
이미 ch4 에서 access logging 에서 살짝 살펴보았고
-
ch8 에서는 tracing 을 살펴 볼 것 입니다
지금까지 existing standard metric (istio_requests_total)의 dimension 을 커스텀 해보았습니다.
7.4.2 신규 메트릭 생성하기
커스텀 메트릭을 만들어 봅시다
# cat ch7/metrics/istio-operator-new-metric.yaml
---
apiVersion: install.istio.io/v1alpha1
kind: IstioOperator
spec:
  profile: demo
  values:
    telemetry:
      v2:
        prometheus:
          configOverride:
            inboundSidecar:
              definitions:
              - name: get_calls
                type: COUNTER
                value: "(request.method.startsWith('GET') ? 1 : 0)"
            outboundSidecar:
              definitions:
              - name: get_calls
                type: COUNTER
                value: "(request.method.startsWith('GET') ? 1 : 0)"
            gateway:
              definitions:
              - name: get_calls
                type: COUNTER
                value: "(request.method.startsWith('GET') ? 1 : 0)"
- get_calls ⇒ istio_get_calls (prefix “istio_” is added automatically.)
- CEL, Common Expression Language https://opensource.google/projects/cel
- must return an integer for type COUNTER
## 적용
istioctl install -y -f ch7/metrics/istio-operator-new-metric.yaml
## 확인
kubectl get istiooperator -n istio-system installed-state -o yaml  | grep -A2 get_calls$

#...
definitions:
- name: get_calls
  type: COUNTER
  value: '(request.method.startsWith('GET') ? 1 : 0)'
#...

kubectl get envoyfilter -n istio-system stats-filter-1.16 -o yaml | grep get_calls

#...
value: |
 {"definitions":[{"name":"get_calls","type":"COUNTER","value":"(request.method.startsWith('GET') ? 1 : 0)"}]}
#...
Pod annotation (proxy.istio.io/config)에 메트릭 istio_get_calls 을 추가해 줍니다
- proxyStatsMatcher.inclusionPrefixes[] ~ metrics 추가
- extraStatTags[] ~ dimensions 추가
- Istio 1.16, 1.17에서 확인결과 custom metric 추가 시 어노테이션(
proxyStatsMatcher.inclusionPrefixes) 설정없이도 메트릭이 추가됩니다
# cat ch7/metrics/webapp-deployment-new-metric.yaml
#...
spec:
  replicas: 1
  selector:
    matchLabels:
      app: webapp

  template:
    metadata:
      annotations:
        proxy.istio.io/config: |-
          proxyStatsMatcher:
            inclusionPrefixes:
            - "istio_get_calls"
      labels:
        app: webapp
#...
## 적용
kubectl -n istioinaction apply -f\
 ch7/metrics/webapp-deployment-new-metric.yaml
## 호출
curl -H "Host: webapp.istioinaction.io" localhost/api/catalog
## 메트릭 확인
kubectl -n istioinaction exec -it deploy/webapp -c istio-proxy \
-- curl localhost:15000/stats/prometheus | grep istio_get_calls

istio_get_calls{} 2
- 추가한 metric “istio_get_calls{}” 이 출력됨
- istio_get_calls (metric)에 대한 dimension 은 하나도 없음
GET 요청을 카운트 하는 메트릭을 만들어 보았는데요.
catalog 서비스의 /items 에 대한 요청을 카운트 하려면 어떻게 해야 할까요?
이어서 Dimension과 attribute 를 생성해 보겠습니다.
7.4.3 Grouping calls with new attributes
기존 attributes 를 가지고 새로운 attributes 를 만들 수 있습니다.
EnvoyFilter의 attribute-gen 필터를 이용하여 새로운 attribute를 정의해 봅니다.
1.attribute-gen : 커스텀 Attribute(istio_operationId)를 생성하는 envoyfilter 명세를 확인해 보세요
# cat ch7/metrics/attribute-gen.yaml
---
apiVersion: networking.istio.io/v1alpha3
kind: EnvoyFilter
metadata:
  name: attribute-gen-example
  namespace: istioinaction
spec:
  configPatches:
  ## Sidecar Outbound
  - applyTo: HTTP_FILTER
    match:
      context: SIDECAR_OUTBOUND
      listener:
        filterChain:
          filter:
            name: envoy.filters.network.http_connection_manager
            subFilter:
              name: istio.stats
      proxy:
        proxyVersion: ^1\.16.*
    patch:
      operation: INSERT_BEFORE
      value:
        name: istio.attributegen
        typed_config:
          '@type': type.googleapis.com/udpa.type.v1.TypedStruct
          type_url: type.googleapis.com/envoy.extensions.filters.http.wasm.v3.Wasm
          value:
            config:
              configuration:
                '@type': type.googleapis.com/google.protobuf.StringValue
                value: |
                  {
                    "attributes": [
                      {
                        "output_attribute": "istio_operationId",
                        "match": [
                         {
                           "value": "getitems",
                           "condition": "request.url_path == '/items' && request.method == 'GET'"
                         },
                         {
                           "value": "createitem",
                           "condition": "request.url_path == '/items' && request.method == 'POST'"
                         },
                         {
                           "value": "deleteitem",
                           "condition": "request.url_path == '/items' && request.method == 'DELETE'"
                         }
                       ]
                      }
                    ]
                  }
              vm_config:
                code:
                  local:
                    inline_string: envoy.wasm.attributegen
                runtime: envoy.wasm.runtime.null
- 아래 attribute-gen.yaml 을 적용하기 전에
proxyVersion: ^1\.16.*을 설치된 istio 버전에 맞게 1.16 혹은 1.17 로 수정해 주세요## istio 버전 확인 istioctl version client version: 1.16.1 control plane version: 1.16.1 data plane version: 1.16.1 (4 proxies) -
버전을 수정 후 envoyfilter 를 배포합니다. envoyfilter를 배포한 네임스페이스의 istio-proxy들에 적용 됩니다
kubectl apply -f ch7/metrics/attribute-gen.yaml -n istioinaction
2.Create a new dimension (upstream_operation) : 1에서 생성한 attribute (istio_operationId)를 사용하는 dimension 생성. catalog API의 /items 호출하는 metric에 추가
# cat ch7/metrics/istio-operator-new-attribute.yaml
---
apiVersion: install.istio.io/v1alpha1
kind: IstioOperator
spec:
  profile: demo
  values:
    telemetry:
      v2:
        prometheus:
          configOverride:
            outboundSidecar:
              metrics:
              - name: requests_total
                dimensions:
                  upstream_operation: istio_operationId
istioctl install -y -f ch7/metrics/istio-operator-new-attribute.yaml
## 확인 outboundSidecar 에만 적용됨
# kubectl get istiooperator -n istio-system installed-state -o yaml | grep -B2 -A1 istio_operationId$

#...
              metrics:
              - dimensions:
                  upstream_operation: istio_operationId
                name: requests_total
#...
3.Pod Annotation(proxy.istio.io/config) 에 dimension (upstream_operation) 추가
- extraStatTags[] ~ dimensions 추가
- proxyStatsMatcher.inclusionPrefixes[] ~ metrics 추가
- istio 1.17+ 부터는 extraStatTags와 proxyStatsMatcher 등 어노테이션 설정 없이도 자동으로 추가된 dimension과 metric 이 반영됩니다
# cat ch7/metrics/webapp-deployment-extrastats-new-attr.yaml
---
apiVersion: apps/v1
kind: Deployment
metadata:
  labels:
    app: webapp
  name: webapp
spec:
  replicas: 1
  selector:
    matchLabels:
      app: webapp
  template:
    metadata:
      annotations:
        proxy.istio.io/config: |-
          extraStatTags:
          - "upstream_operation"
      labels:
        app: webapp
    spec:
      containers:
      - env:
        - name: KUBERNETES_NAMESPACE
          valueFrom:
            fieldRef:
              fieldPath: metadata.namespace
        image: istioinaction/webapp:latest
        imagePullPolicy: IfNotPresent
        name: webapp
        ports:
        - containerPort: 8080
          name: http
          protocol: TCP
        securityContext:
          privileged: false
kubectl -n istioinaction apply -f\
 ch7/metrics/webapp-deployment-extrastats-new-attr.yaml
호출테스트
curl -H "Host: webapp.istioinaction.io" \
http://localhost/api/catalog
메트릭 확인 : dimension (upstream_operation) 추가 확인!
kubectl -n istioinaction exec -it deploy/webapp -c istio-proxy \
-- curl localhost:15000/stats/prometheus | grep istio_requests_total

..
istio_requests_total{response_code="200",reporter="source",source_workload="webapp",source_workload_namespace="istioinaction",source_principal="spiffe://cluster.local/ns/istioinaction/sa/webapp",source_app="webapp",source_version="unknown",source_cluster="Kubernetes",destination_workload="catalog",destination_workload_namespace="istioinaction",destination_principal="spiffe://cluster.local/ns/istioinaction/sa/catalog",destination_app="catalog",destination_version="v1",destination_service="catalog.istioinaction.svc.cluster.local",destination_service_name="catalog",destination_service_namespace="istioinaction",destination_cluster="Kubernetes",request_protocol="http",response_flags="-",grpc_response_status="",connection_security_policy="unknown",source_canonical_service="webapp",destination_canonical_service="catalog",source_canonical_revision="latest",destination_canonical_revision="v1",upstream_operation="getitems"} 1
You should know that the more our applications communicate over the network, the more things can go wrong !
Having a consistent view into what’s happening between services is almost prerequisite to running a MSA.
Istio makes metrics collection between services easier by observing things like success rate, failure rate, number of retries, latency …
Istio can simplify collecting golden-signal networking metrics.
이번 챕터에서는 Istio의 data-plane(Envoy) 과 control-plane(istiod) 의 메트릭 수집 (scraping)에 대해서 알아 보았습니다.
그리고, custom dimensions, custom metrics 등 메트릭을 확장 (extending)하는 방법과 프로메테우스로 메트릭을 모으는 방법(aggregating)에 대해 살펴 보았습니다.
다음 챕터에서는 “Visualizing Metrics ” (Grafana, Kiali) 에 대해 살펴보겠습니다.
Summary
- Monitoring is the process of collecting and aggregating metrics to watch for known undesirable states so that corrective measures can be taken. 모니터링은 “알려진 이상상태를 감지”하여 시정조치가 이루어질 수 있도록 메트릭을 수집하고 어그리게이션하는 프로세스입니다.
- Istio collects the metrics used for monitoring when intercepting requests in the sidecar proxy. Because the proxy acts at layer7 (the application-networking layer), it has access to a great deal of information such as status codes, HTTP methods, and headers that can be used in metrics. Istio 는 sidecar proxy (Envoy) 에서 요청을 처리할 때 모니터링을 위한 메트릭을 수집합니다.
- One of the key metrics is
istio_requests_total, which counts requests and answers questions such as how many requests ended with status code 200.istio_requests_total은 요청 상태별 집계 등 다양한 요청 집계를 제공하는 핵심 메트릭 입니다. - The metrics exposed by the proxies set the foundation to build an observable system. 프록시에서 제공하는 메트릭들은 관측가능한 시스템을 만드는 기반을 제공합니다.
- By default, Istio configures the proxies to expose only a limited set of statistics. You can configure the proxies to report more mesh-wide using the
meshConfig.defaultConfigor on a per-workload basis using the annotationproxy.istio.io/config. Istio 기본설정은 proxy metric 을 제한적으로 노출합니다. 메트릭을 더 노출하고 싶다면 mesh-wide (globally) 설정은meshConfig.defaultConfig를 통해서 하고, workload 단위로 설정하려면proxy.istio.io/config어노테이션에 설정합니다. - The control plane also exposes metrics for its performance. The most important is the histogram
pilot_proxy_convergence_time, which measures the time taken to distribute changes to the proxies. control plane 은 Istio 성능 관련 메트릭을 제공합니다. 가장 중요한 메트릭은pilot_proxy_convergence_time히스토그램인데요 프록시들로 설정이 적용되는데 걸리는 시간을 측정합니다. - We can customize the metrics available in Istio using the
IstioOperatorand use them in services by setting theextraStatsvalue in the annotationproxy.istio.io/configthat defines the proxy configuration. This level of control gives the operator (end user) flexibility over what telemetry gets scraped and how to present it in dashboards. 메트릭 커스터마이징은 IstioOperator “명세”를 통해서 하고 앱에서 (커스텀) 메트릭을 사용하려면proxy.istio.io/config어노테이션의 value로extraStats를 설정합니다.
(istio 1.17+ 부터는 어노테이션 설정은 필요하지 않습니다)
👉🏻 다음편 보기